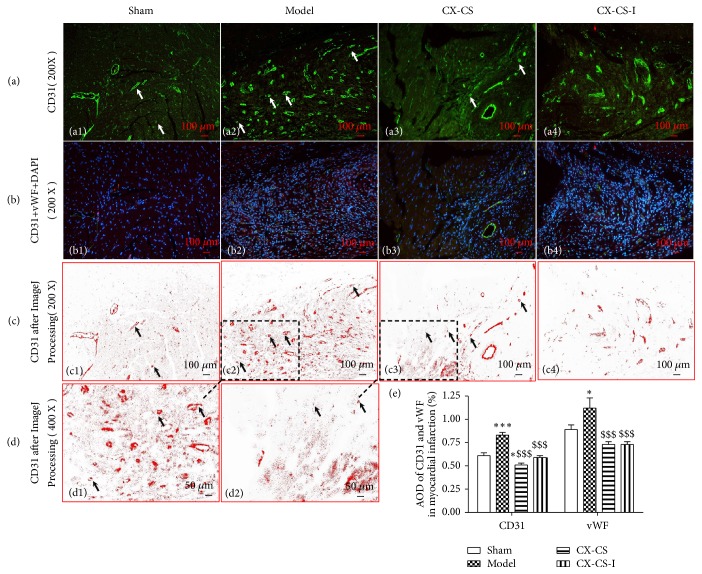
Figure 4.
AODs of CD31 and vWF in MI area. (a) Immunofluorescence staining of CD31 in the MI area. (b) Merged images of CD31, vWF, and DAPI. (c and d) Images processed by ImageJ after immunofluorescence staining of CD31. (e) AOD analysis of CD31 and vWF. The arrows point to angiogenesis or endothelial cells. ∗P<0.05; ∗∗∗P<0.001 vs. sham group; $$$P<0.001 vs. model group. n=6.

