Figure 2.

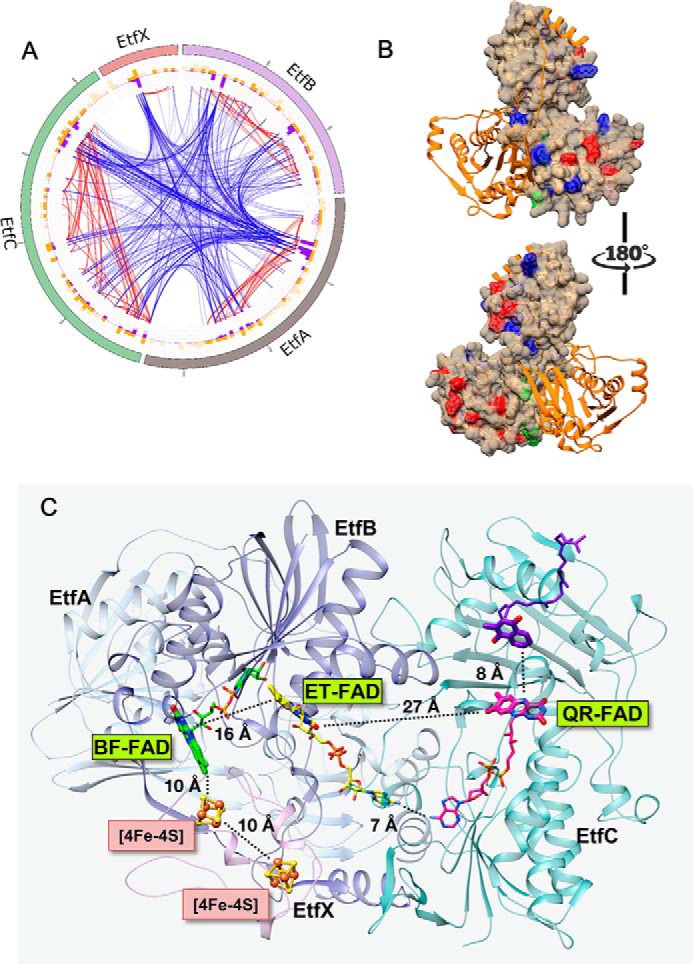
A, the multilayer circular plot presents interactions within the P. aerophilum EtfABCX complex captured by cross-linking (BS3). The most outer layer represents the protein sequence: EtfA is shown in gray, EtfB is purple, EtfC is green, and EtfX is pink. Yellow and purple histograms show the location of BS3 target residues (Lys and Ser) and the density of cross-links, respectively. Blue lines represent connections between subunits (intersubunit cross-links), and red lines highlight interactions within a single unit (intrasubunit cross-links). Cross-links maintaining less than 20 ppm error and a score higher than 3 (a score >2 is considered significant) are displayed. B, protein surface map of the complete P. aerophilum EtfABCX complex (for simplicity, only the AB dimer is presented) shows GEE (modification sites shown in red) and DnsCl (modification sites shown in blue) labels incorporated in to the native complex during short exposure to the two labeling reagents. Residues at the dimer interface highlighted in green correspond to labels integrated into the structure exclusively in the latest time points. Individual proteins are color-coded as follows: EtfB in orange and EtfA in tan. C, ribbon diagram of the MS-validated EtfABCX model. EtfA and EtfB are shown in light and dark blue, respectively, EtfC is teal, EtfX is magenta, the BF-FAD is green, the ET-FAD is yellow, and the QR-FAD is pink. Organic cofactors are shown using thick sticks to emphasize the redox-active portions and thin sticks to complete the structures. Iron–sulfur clusters are shown in orange (Fe) and yellow (S), and the menaquinone (purple) was modeled using the 2GMH (porcine electron transfer flavoprotein-ubiquinone oxidoreductase) structure with bound ubiquinone.
