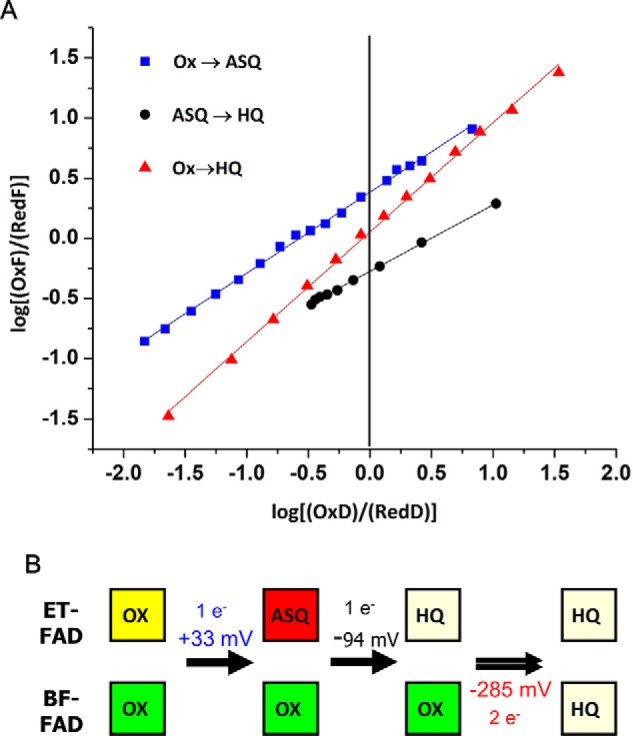
Figure 3.

A, slopes of Nernst plots confirm the 1 e− nature of events in phases 1 and 2 and the 2 e− nature of phase 3. Best linear fits are as follows: phase 1 (blue), 0.66x + 0.55 (R2 = 0.997); phase 2 (black), 0.55x − 0.27 (R2 = 0.999), and phase 3 (red), 0.91x + 0.05 (R2 = 0.998). For the data in blue the “oxidized” flavin is OX, “reduced” flavin is the ASQ, and the dye is thionine. For the data in black the oxidized flavin is ASQ, reduced flavin is the HQ, and the dye is Nile blue. For the data in red, oxidized flavin is OX, reduced flavin is HQ, and the dye is safranin-O. B, proposed reduction events for each FAD cofactor in EtfAB and the measured potentials.
