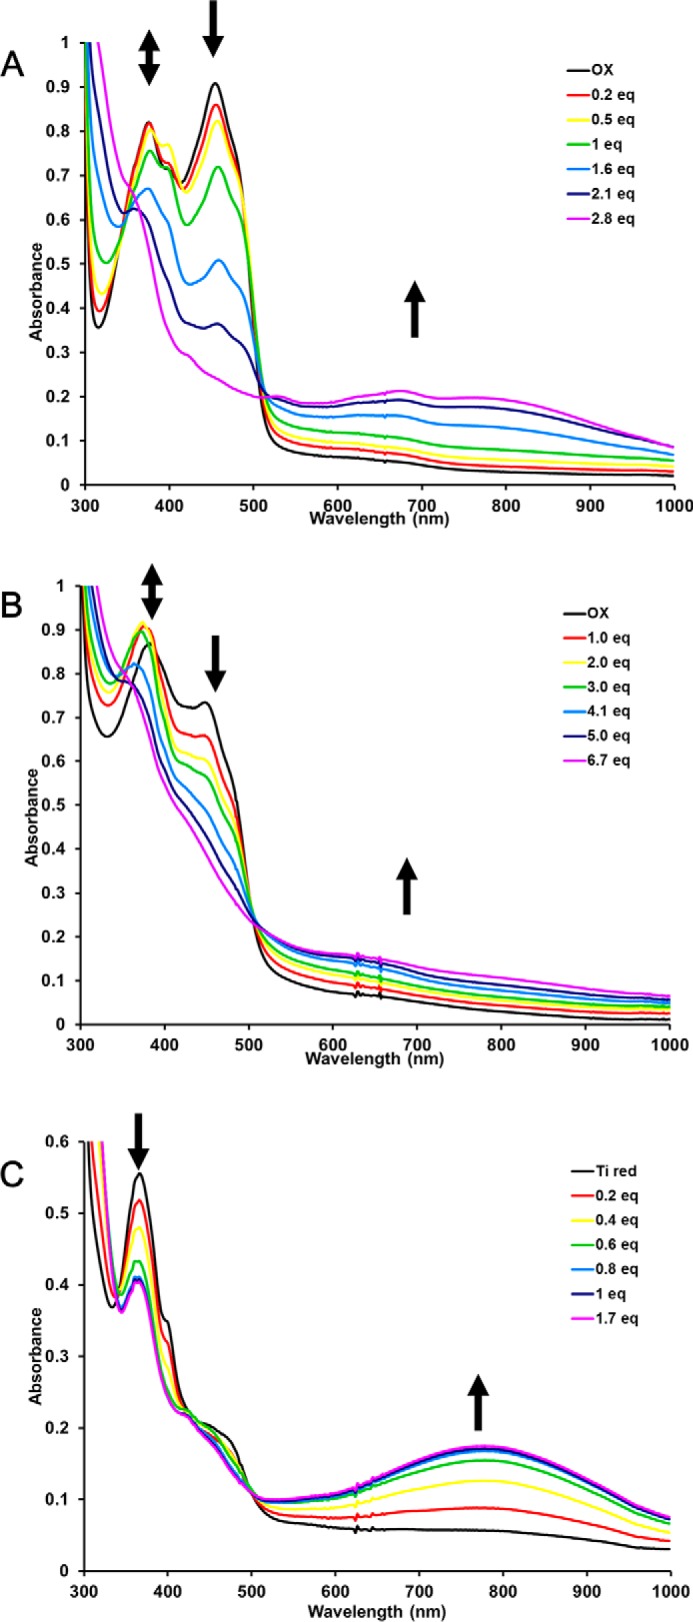
Figure 4.

Titration of P. aerophilum EtfAB (74 μm) (A) and EtfABCX (15 μm) (B) with NADH. Arrows (left to right) indicate formation and disappearance of the ASQ, disappearance of OX flavin absorbance, and the formation of a broad CT complex. C, anaerobic titration with NAD+ of P. aerophilum EtfAB (74 μm) reduced with excess titanium citrate. Arrows (left to right) indicate the disappearance of ASQ and the formation of a broad CT complex.
