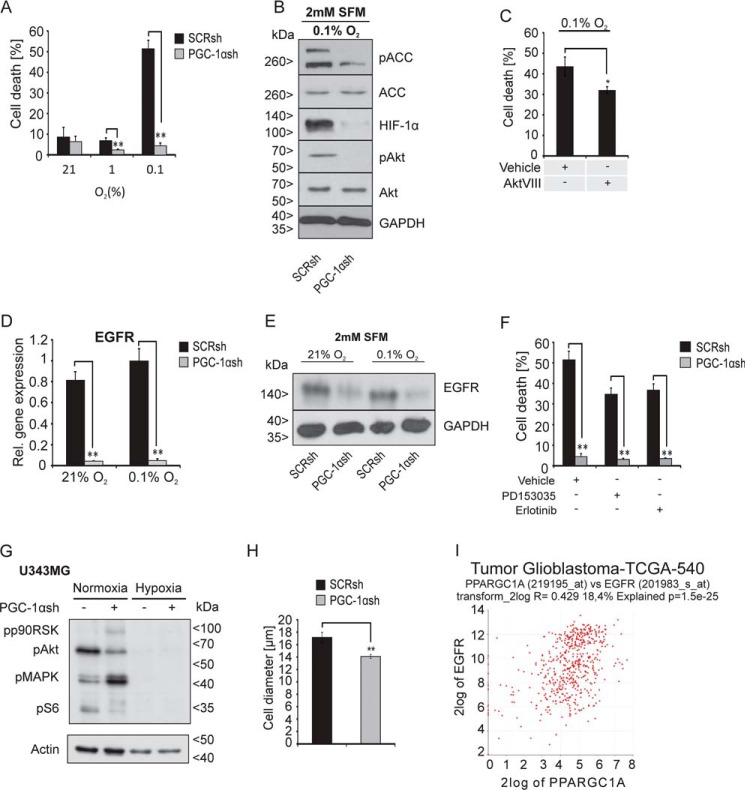
Figure 5.
Cells lacking PGC-1α are strongly protected against hypoxia-induced cell death and exhibit down-regulation of the EGFR. A, cells were incubated at 21, 1, or 0. 1% oxygen in SFM for 30 h, stained with PI, and analyzed by flow cytometry analysis, where PI-positive cells were rated as dead cells. B, cells were exposed to SFM under 0.1% oxygen for 24 h, and the protein expression of HIF-1α, pACC, ACC, pAkt, and Akt was determined by immunoblot analysis. C, cells were treated with vehicle (DMSO) or AktVIII (10 μm) for 30 h under SFM and hypoxia, and cell death was analyzed by PI-FACS. D, expression of EGFR in SCRsh and PGC-1αsh cells after exposure to SFM (2 mm) and 21 or 0.1% oxygen for 24 h was analyzed by qPCR (D) and immunoblot analysis (E). F, SCRsh cells were treated with vehicle (DMSO) or with the EGFR inhibitors PD153035 (10 μm) and Erlotinib (10 μm) for 30 h at 2 mm glucose in SFM, and cell death was analyzed by PI-FACS. G, LNT-229 SCRsh and PGC-1αsh cells were incubated for 8 h in SFM with 2 mm glucose in normoxia or hypoxia, and downstream signaling of the EGFR was examined by immunoblot analysis of phosphorylated p90RSK, phosphorylated Akt (pAkt), phosphorylated ERK1/2 (pMAPK), and phosphorylated S6 protein (pS6), and actin served as internal control. H, cell pellets of SCRsh and PGC-1αsh cells were used for evaluation of the cell size by light microscopy and analysis software (Olympus). I, in silico analysis using the R2 database displays a correlation between PGC-1α and EGFR expression in glioma patients. The investigation was performed also using only glioblastoma samples and the dataset “Tumor Glioblastoma–TCGA–540–MAS5.0–u133a” in the R2 database.

