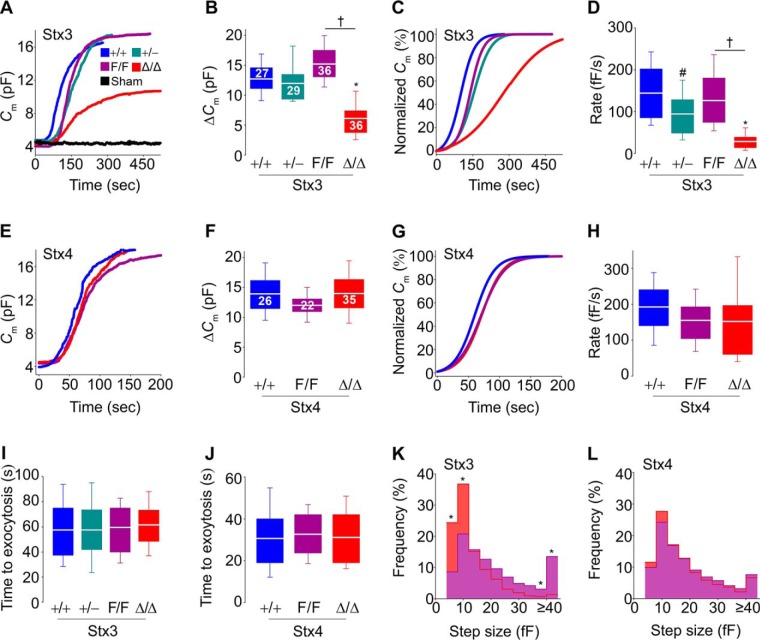
Figure 2.
Absence of Stx3, but not Stx4, influences the amount, rate, and size of vesicles exocytosed in MCs. Shown are Cm recordings of individual peritoneal MCs after stimulation by intracellular dialysis of GTPγS and Ca2+. Access to the cell interior was obtained via establishment of the whole-cell recording configuration at time 0. Sham, +/+ MCs dialyzed with a solution lacking GTPγS. The color key in A applies to all panels. A and E, representative traces of Cm recordings. B and F, ΔCm after stimulation. Numbers inside boxes in B and F, number of cells studied, obtained from 6–8 animals of each genotype; applies to D, H, and I–L. C and G, representative normalized Cm traces. D and H, rate of exocytosis between 40 and 60% of total ΔCm. I and J, time between cell access and beginning of the exocytic burst. K and L, frequency distribution of Cm step sizes between 1 and 15% of total ΔCm. Signals < 4 fF have been removed for clarity. White line, mean; box, 25th–75th percentile; whiskers, 5th–95th percentile. #, p ≤ 0.05; †, p ≤ 0.01; *, p ≤ 0.001; all compared with +/+ MCs unless otherwise specified.

