
Figure 5.
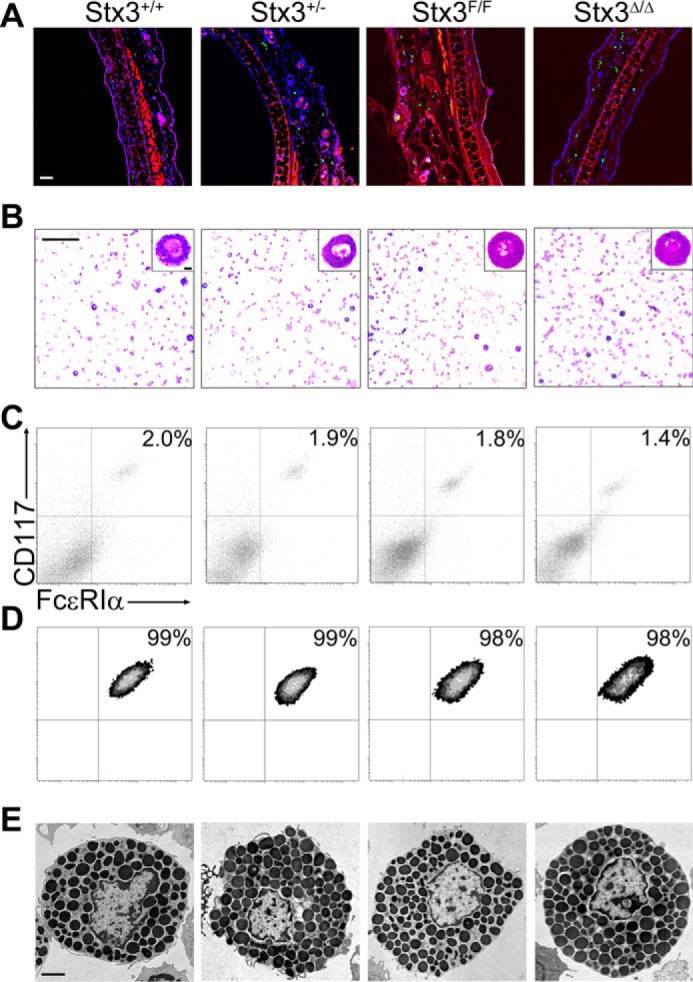
Absence of Stx3 does not affect the total number, distribution or structure of MCs. Shown are representative images; for detailed quantification, please refer to Table 1. A, ear sections stained with FITC-avidin (green) and Hoechst (blue); autofluorescence in the red channel delimited the dermis. Scale bar, 50 μm. B, cytospins of peritoneal MCs stained with Wright–Giemsa. Scale bar, 200 μm; inset scale bar, 50 μm. Flow cytometry of peritoneal MCs (C) and PCMCs (D) labeled with antibodies against CD117 and FcϵRIα. E, EM profiles of resting peritoneal MCs. Scale bar, 2 μm.