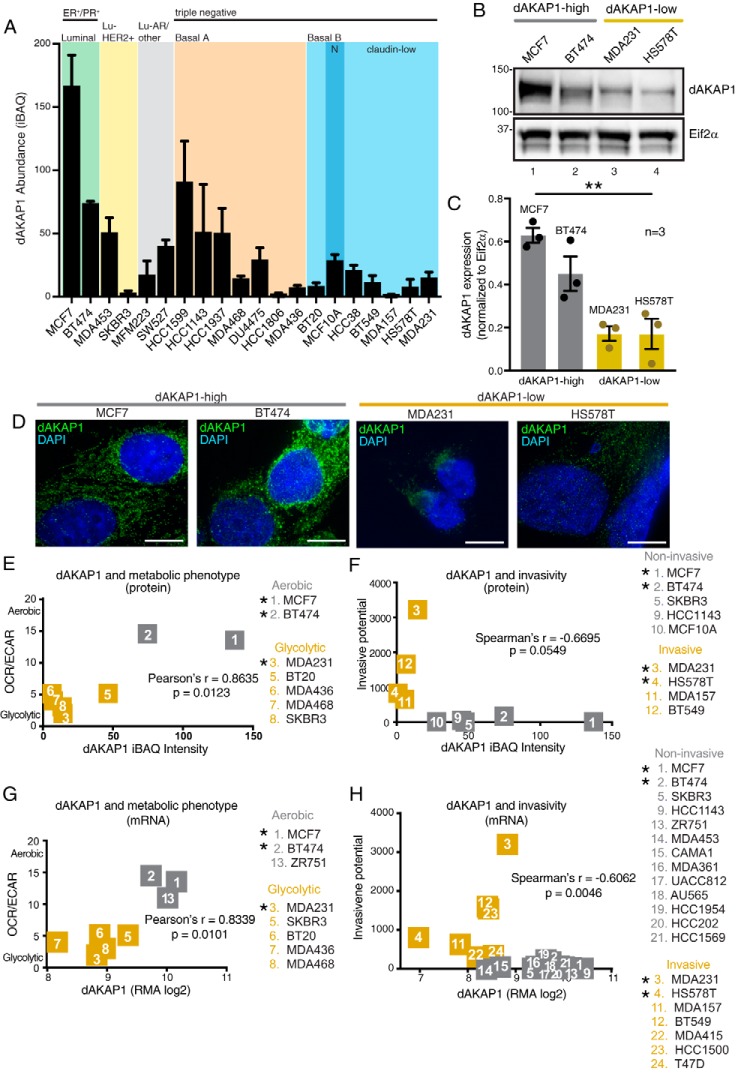
Figure 3.
Classification of dAKAP1-high and dAKAP1-low breast cancer cell lines. A, average dAKAP1 iBAQ intensities across 20 breast cancer cell lines (data extracted from Table S1 and reported in Ref. 34). The subtype classification is indicated above each shaded region. Error bars indicate standard deviation between quantified dAKAP1 protein identifiers. B, immunoblot analysis of dAKAP1 levels (top) and Eif2α (bottom) loading control in representative breast cancer cell lines. C, quantification of amalgamated data (n = 3 independent blots) by densitometry. Error bars represent S.E. Statistical significance was determined by ordinary one-way ANOVA (p = 0.0013; F(3, 8) = 14.76). MCF7 and BT474 cells (gray) were designated dAKAP1-high. MDA231 and HS578T (gold) cells were designated dAKAP1-low. (See also magenta circles in Fig. 2F.) D, immunofluorescent detection of dAKAP1 (green) and nuclei (blue) in each cell line. Scale bars (10 μm) are indicated. E and F, scatter plots comparing dAKAP1 protein expression (34) with metabolic analysis of aerobic respiration/glycolysis (OCR/ECAR) (35) (E). Cell lines are designated as predominantly glycolytic (gold) or aerobic (gray). F, comparison with invasive potential (36) assessed by Transwell assay. G and H, mRNA expression for the same breast cancer cell lines (29) to metabolic analysis (35) (G) or invasive potential (H) (36). * denotes cell lines used experimentally.

