Figure 6.
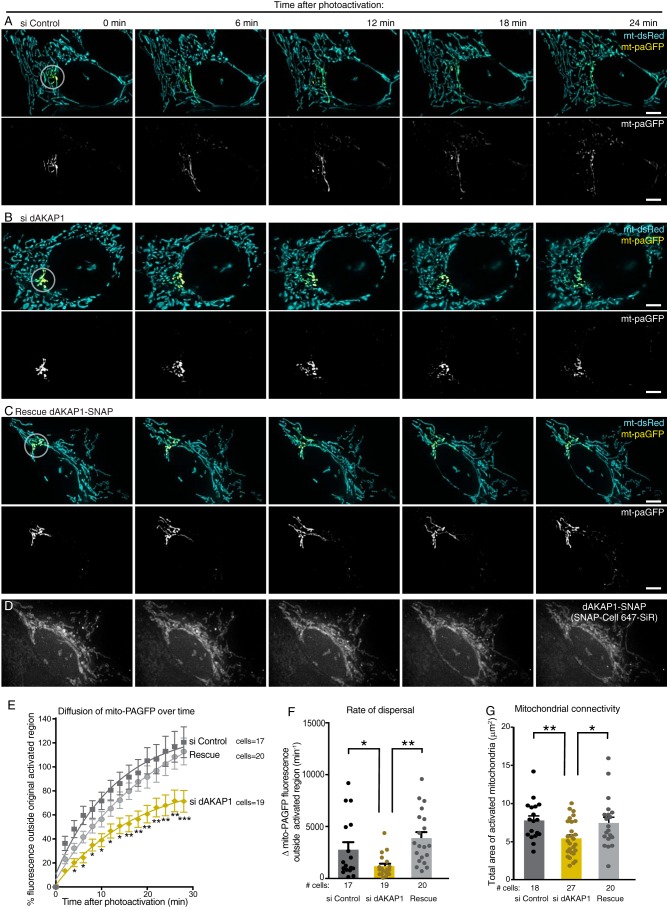
Live-cell imaging analyses of mitochondrial dynamics. A–C, tracking of mitochondrially targeted paGFP (yellow) and whole-cell detection of photostable mitochondrially targeted dsRed (teal) monitored organellar dynamics over a time course of 24 min. Analysis was conducted on MCF7 cells treated with siControl (A), si-dAKAP1 (B), and rescue (C) upon expression of murine SNAP-tagged dAKAP1. Upper rows, composite images of both fluorescent channels. White circles denotes site of photoactivation. Lower rows, gray-scale images of paGFP signal. D, detection of SNAP-tagged dAKAP1 upon conjugation of 647-SiR fluorescent dye. Scale bars (5 μm) are indicated. E, diffusion of fluorescent paGFP signal was calculated. Amalgamated data for siControl (charcoal), si-dAKAP1 (gold), and rescued cells (gray). The numbers of cells in each analysis are indicated. Error bars represent S.E. Statistical significance was determined individually by two-tailed Student's t test. The rates of dispersal (F) and degrees of mitochondrial connectivity (G) were calculated for the same experimental conditions. The number of cells used in each analysis is indicated below each column. Data were collected over n ≥ 4 independent experiments. Error bars represent S.E. Statistical significance was determined by two-tailed Student's t test. Welch's correction was used in F to account for uneven variances.

