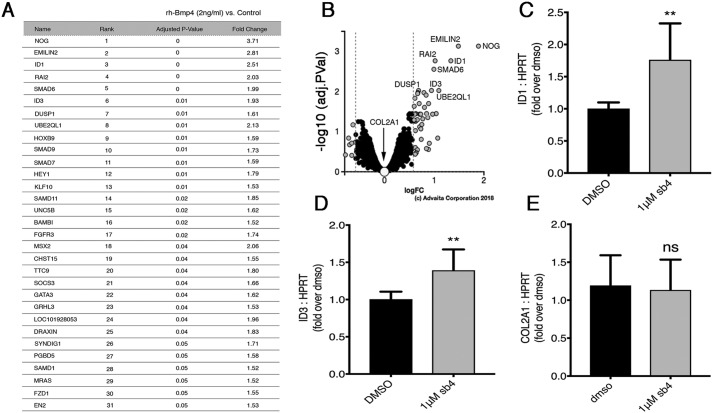
Figure 7.
sb4 can activate endogenous BMP4 target genes. A, the top 31 genes with increased transcriptional activation after 4 h of rhBMP4 (2 ng/ml) as determined by Affymetrix microarrays. Triplicate biological replicates were performed for treated and untreated groups. The p values ≤ 0.05 and -fold changes ≥ 1.5 are reported for treated versus untreated groups. B, volcano plot of 6,643 genes that were measured for expression. 51 genes were differentially expressed between treated and untreated groups. Significant differentially expressed genes are shown as gray dots; black and selected white dots represent nonsignificant genes. The volcano plot was generated by uploading transcriptomic data into iPathwayGuide, with cut-off -fold change and p values set to 0.58 and 1, respectively. C–E, quantitative RT-PCR analysis was used to determine the relative mRNA levels of endogenous rhBMP4 target genes after 1 μm sb4 treatment. The Id1 (C) and Id3 (D) genes show significant up-regulation, whereas CoL2A1 (E) remains unchanged. Data represent the mean and 1 S.D. from three independent biological experiments performed in triplicate (**, p < 0.01; ns, not significant: unpaired t test). Error bars, S.D.

