Figure 5.
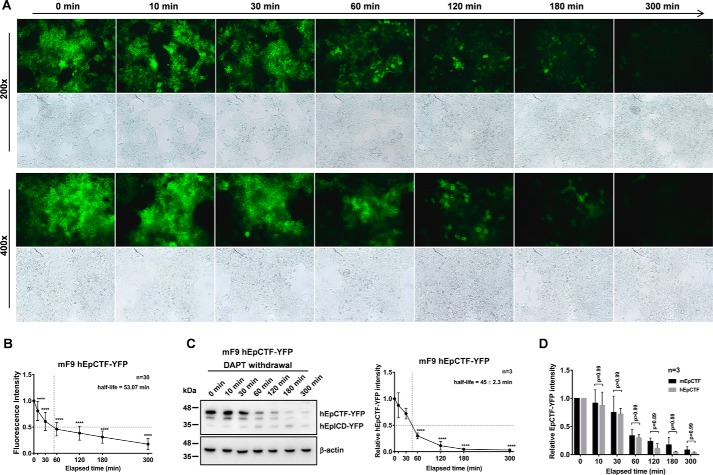
Cleavage of hEpCTF in murine F9 teratoma cells. A, human EpCTF-YFP was stably expressed in murine F9 teratoma cells. Following pretreatment with DAPT (see “Experimental procedures”), cells were maintained in normal medium for a further 5 h. Cells were monitored at the indicated time points by immunofluorescence microscopy. Shown are representative pictures at the indicated time points from n = 3 independent experiments at ×200 and ×400 magnification. B, immunofluorescence microscopy results shown in A were quantified from n = 30 cells from n = 3 independent experiments. Shown are mean values ± S.E. (error bars). p values were calculated with one-way ANOVA. ****, p < 0.0001. C, visualization and quantification of hEpCTF-YFP and hEpICD-YFP expression and calculation of hEpCTF 50% protein turnover was performed from n = 3 independent immunoblotting experiments. Shown are mean values with S.E. p values were calculated with one-way ANOVA. ****, p < 0.0001. D, two-way ANOVA was used to calculate the difference at each time point between mEpCTF and hEpCTF in mF9 cells. The overall p value of the test is 0.96 with individual p values ranging from 0.88 to 0.99.

