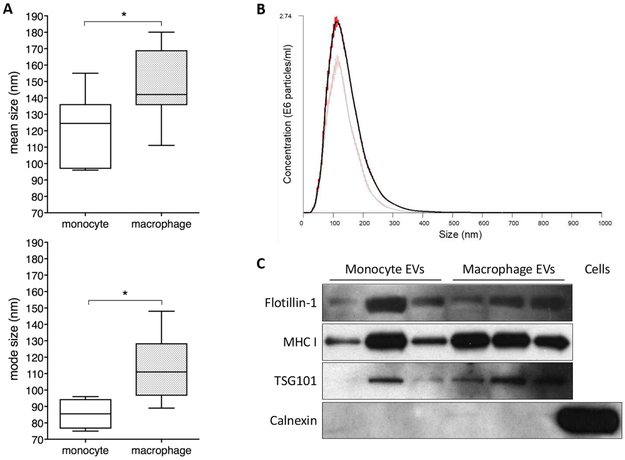
Figure 1. Characterisation of monocyte and macrophage EVs.
Phenotype of EVs released by THP-1 monocytes and macrophages was assessed by Nanoparticle Tracking Analysis (NTA) and western blotting for exosome markers. A) Mean and mode size of EVs released from monocytes (n=6) and macrophages (n=9). B) Representative NTA histogram demonstrating size distribution of EVs from macrophages (dark line) and monocytes (pale line). Red error bars indicate standard error of the mean. C) Western blotting for exosome markers flotillin-1, MHC-I and TSG101 indicate the presence of exosomes in EV preparations, and lack of calnexin indicates the absence of cellular debris. Yield of EVs per million cells plated at start of 24h collection period was 3.5×10⁹ from monocytes and 1.9×10⁹ from macrophages.

