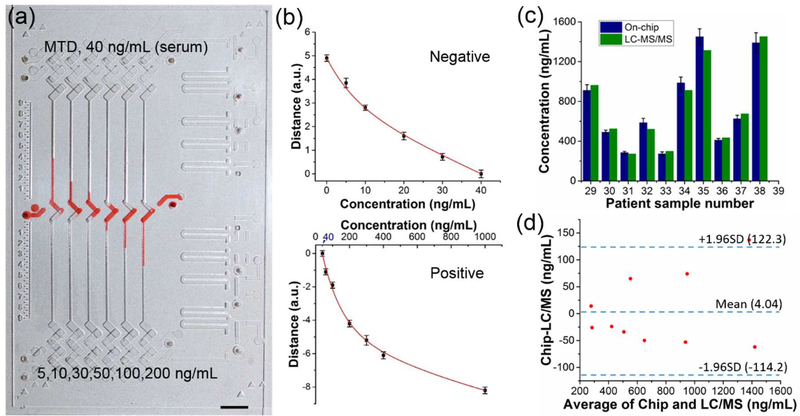
Figure 4.
Test of MTD in patient serum samples. (a) Bar-chart result of the test of MTD in spiked urine samples. These negative and positive samples showed proper inks bars on the device. Scale bar, 0.5 cm. (b) Calibration curves for negative (top) and positive (bottom) samples. (c) Bar graphs of the MTD concentration in the patient serum samples measured by the device (navy blue) and LC-MS/MS (olive), side-by-side. The value of methadone (not its metabolite) was used in the plot for LC-MS/MS data. On-chip data shown as mean of three independent measurements ± S.D. (d) Bland−Altman analysis for assessing agreement between results from the integrated CV-Chip and LC-MS/MS. The 95% confidence interval on the mean value is displayed in the graph. The results showed good correlation between the two methods.

