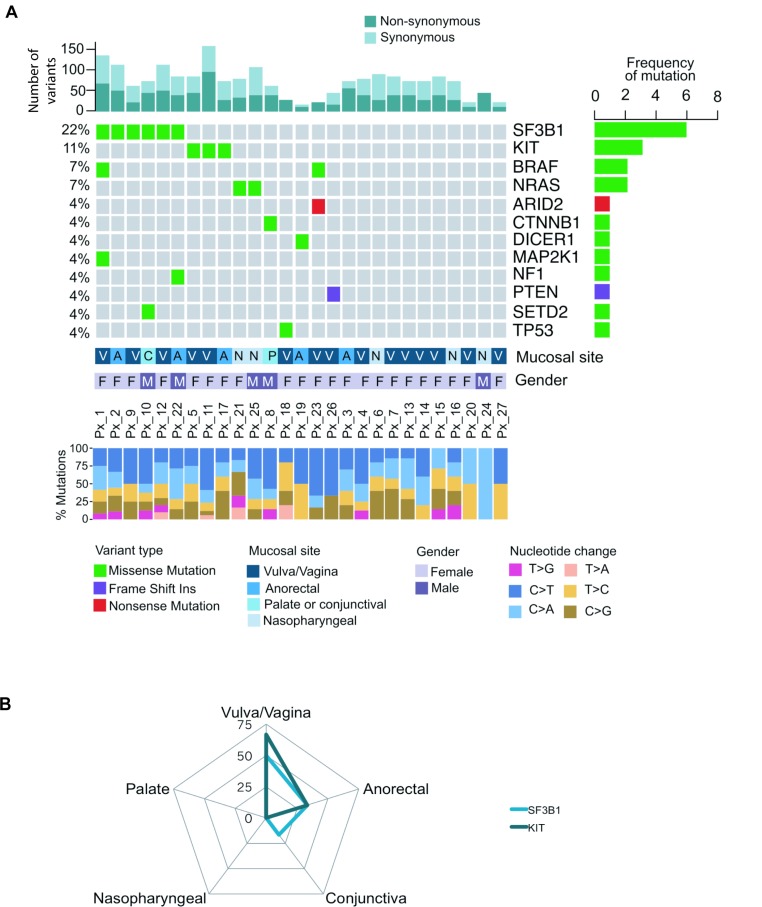
Figure 1. Mutational landscape of 27 melanoma patients across different mucosal sites.
(A) The oncoplot showing the distribution of different mutational types across 19 genes. Each column represents a mucosal melanoma sample (individual patient). Number of driver events for each patient is shown at the top of the panel. The frequency of mutation for each gene is shown in the right panel. The mucosal site, gender and percentage of nucleotide changes for individual patients are presented in the lower panel. (B) The radar graph displays the frequency of various gene mutations in different mucosal sites including vulva/vagina, anorectal, nasopharyngeal, conjunctiva and palate. Height of the peak indicates the frequency of individuals with a mutation in the respective mucosal site.

