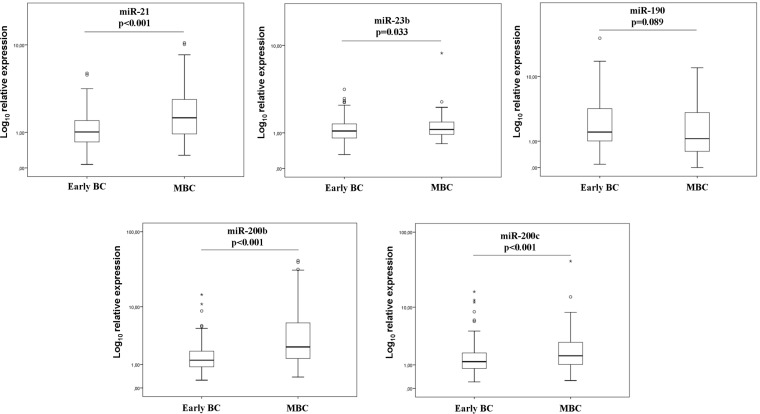
Figure 1. Relative expression levels of circulating miRNAs of early and metastatic patients.
Expression levels of miR-21 (A), miR-23 (B), miR-190 (C), miR-200b (D) and miR-200c (E) were evaluated in the plasma by RT-qPCR and assessed by 2-ΔΔCt method. Statistically significant differences were determined using Mann-Whitney tests and the results were displayed on box plots. Horizontal line depicts median, whereas the length of the boxes is the interquartile range that represents values between the 75th and 25th percentiles of individual fold change expression values. Relative expression values on y-axis are plotted on a log10 scale. Circles represent outliers, whereas asterisks represent extreme outliers. P values are shown.

