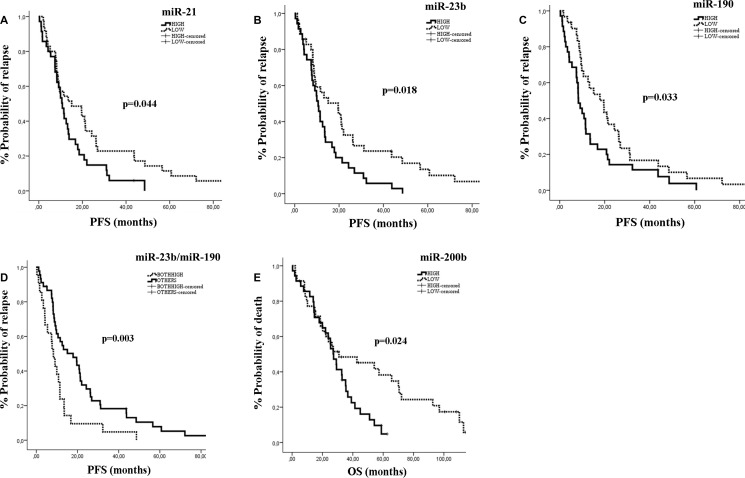
Figure 3. Kaplan–Meier analysis for PFS and OS according to the expression of circulating miRs in MBC patients.
Progression free survival and overall survival in patients with high or low miR-21 (A), miR-23b (B), miR-190 (C), miR-23b/miR-190 (D) and miR-200b (E). Curves were compared using the log rank test. P values are shown.

