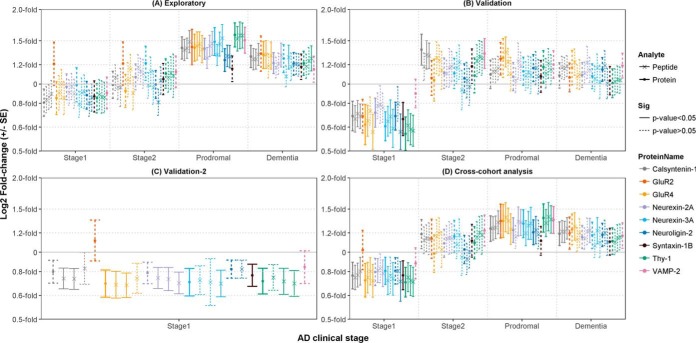
Fig. 2.
Synaptic panel peptide levels in the CSF across the AD continuum. The log2 fold-change (± standard error; S.E.) in CSF levels of the synaptic panel peptides and summarized protein levels are plotted for each preclinical and clinical AD stage versus cognitively normal controls for (A) the exploratory cohort (Controls n = 20, Stage1 n = 10, Stage2 n = 10, Prodromal n = 20, AD dementia n = 20), (B) validation cohort-1 (Controls n = 18, Stage1 n = 9, Stage2 n = 8, Prodromal n = 10, AD dementia n = 15), (C) validation cohort-2 (Controls n = 20, Stage1 n = 18) and (D) the combined mean log2 fold-change across the 3 cohorts. For ease of interpretation, the natural values are labeled on the y axis on a log2 scale. The linestyle of the error bars were determined by p value cut-offs for pair-wise group comparisons using a mixed effect linear regression model (see legend). Stage1; preclinical AD stage 1, Stage2; preclinical stage 2,Prodromal; prodromal AD, Dementia; AD dementia.

