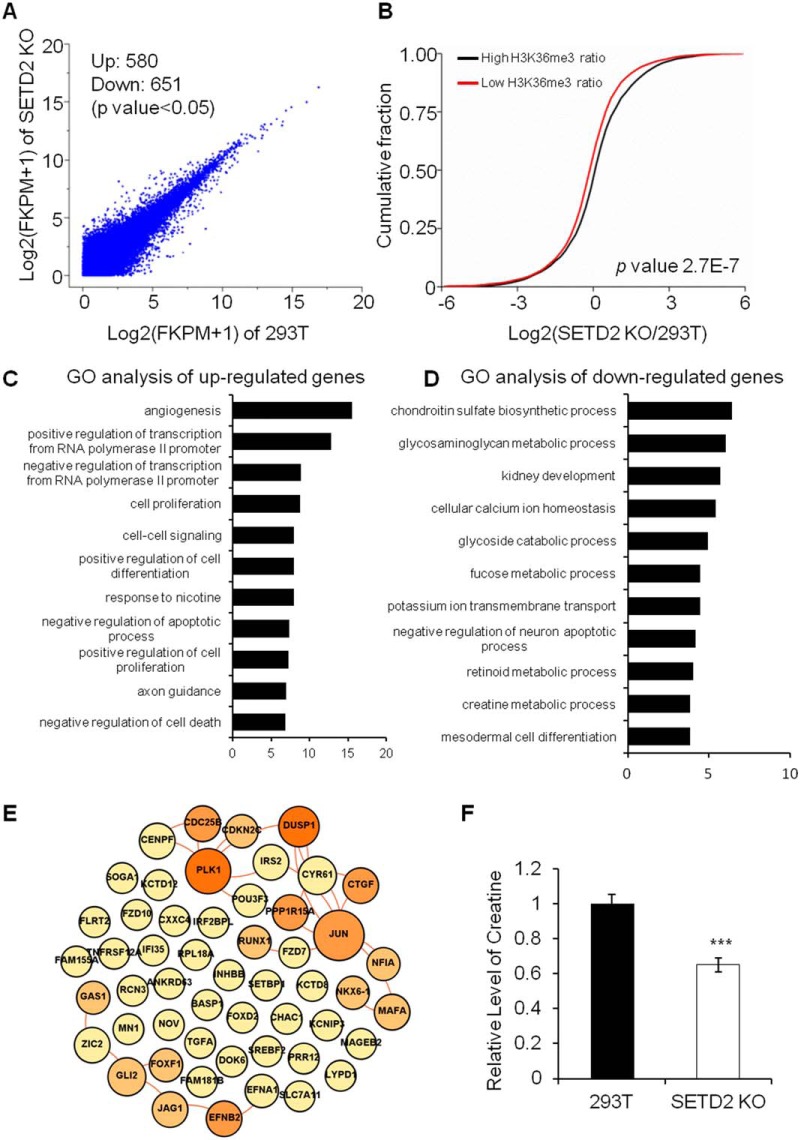
Fig. 3.
A comparison of mRNA expression levels in 293T and SETD2 KO cells obtained by RNA-Seq analysis. The results showed a positive correlation between mRNA expression levels and H3K36me3/H4K16ac levels. In SETD2 KO cells, RNA polymerase II transcription-related genes were upregulated and a large number of genes involved in metabolic pathways were downregulated. A, A scatter plot comparing the log2(FPKM+1) values for RNA-seq data in 293T cells and SETD2 KO cells. A total of 580 and 651 transcripts were significantly (p < 0.05) up- and downregulated, respectively, in SETD2 KO cells. B, Cumulative distribution of the log2(fold changes) of RNA expression in SETD2 KO cells for genes with high H3K36me3 ratio or low H3K36me3 ratio between 293T and SETD2 KO cells. C, Gene Ontology (GO) analysis of upregulated genes in SETD2 KO cells. (D) GO analysis of downregulated genes in SETD2 KO cells. E, The interaction network of upregulated RNA polymerase II transcription-related proteins in SETD2 KO cells. Lines indicate the interaction between proteins. The size and the color of each node are proportional to its interaction protein number. F, Relative levels of creatine in 293T cells and SETD2 KO cells. ***, p < 0.001.

