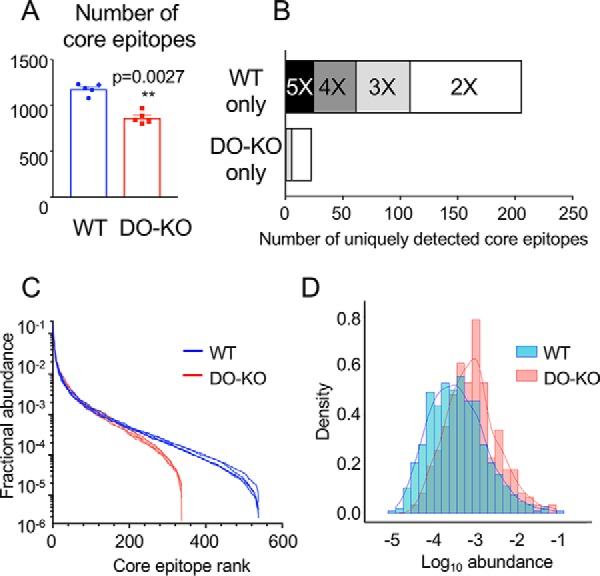
Fig. 3.

DO expression results in presentation of greater numbers of and a broader distribution of core epitopes. A, The number of unique core epitopes observed in WT was significantly greater than for DO-KO-1 cells in each of 5 independent experiments. Mean ± S.D. (n = 5) shown. Paired parametric t test used to calculate p values. B, More core epitopes are identified uniquely in WT as compared with DO-KO-1 samples. Bar shading indicates number of replicate samples for which the core epitope was identified. For example, the black bar labeled “5X” indicates epitopes identified in each of 5 WT samples and none of the 5 DO-KO-1 samples, the dark gray bar labeled “4X” indicates samples identified in 4/5 WT samples and no DO-KO-1 samples, etc. C, Rank abundance plot. Fractional intensity of core epitopes from WT (blue) or DO-KO-1 (red) in each biological sample is represented as an individual line. D, Histogram of fractional intensities of core epitopes, overlaid with a kernel density plot.
