Fig. 5.

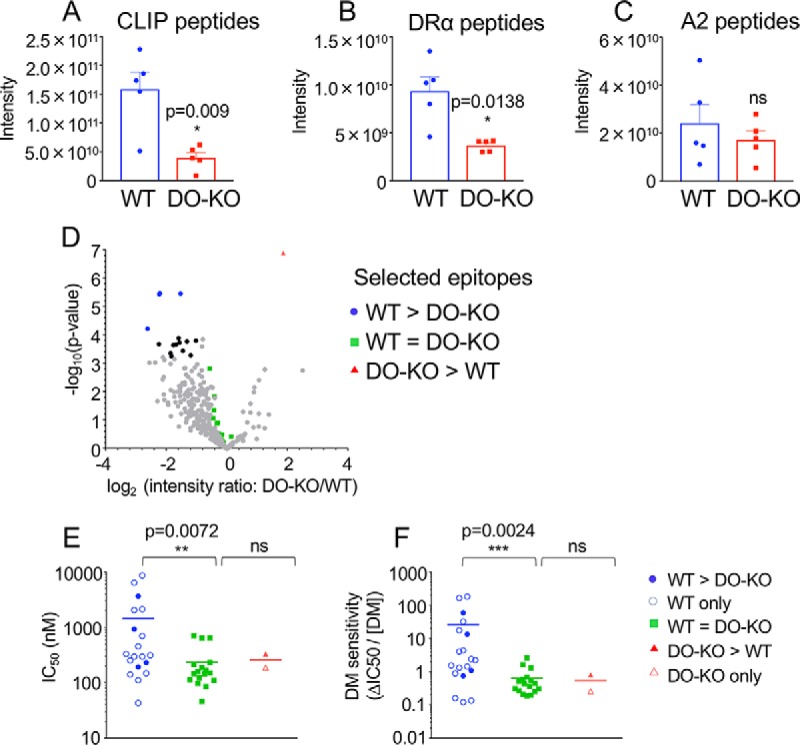
DO expression increases presentation of low affinity and DM-sensitive peptides. A–C, Relative abundance levels for peptides with known DM sensitivity were analyzed in 5 WT and DO-KO-1 samples: DM-sensitive CLIP peptides (58) with core epitope MRMATPLLM (A), DM-sensitive DRα peptides (56) with core epitope FASFEAQGA (B), and DM-resistant A2 peptides (38) with the core epitope WRFLRGYHQ (C). Mean ± S.D. (n = 5) shown. Paired parametric t test used to calculate p values. D, Volcano plot for cores identified in each of all 5 biological samples for WT and DO-KO-1 samples. Cores with intensity ratio differences >2-fold and p values <5.75E-04 (Benjamini-Hochberg-adjusted) are shown as black dots. Cores showing significant differences and selected for binding affinity studies, DM sensitivity studies and absolute quantification studies are shown in blue for WT>DO-KO, red for DO-KO>WT, and green for WT≈DO-KO. E, Binding affinity was characterized for sets of peptides observed in DO-KO only (1 peptide), WT only (15 peptides), or for peptides with intensities of WT>DO-KO (4 peptides), WT<DO-KO (1 peptide), or WT = DO-KO (17 peptides). F, The DM sensitivities for the same sets of peptides were assessed. Mean ± S.D. from 3 independent experiments shown for all peptides in each group; unpaired nonparametric Mann-Whitney test used to calculate p values.
