
Fig. 4.
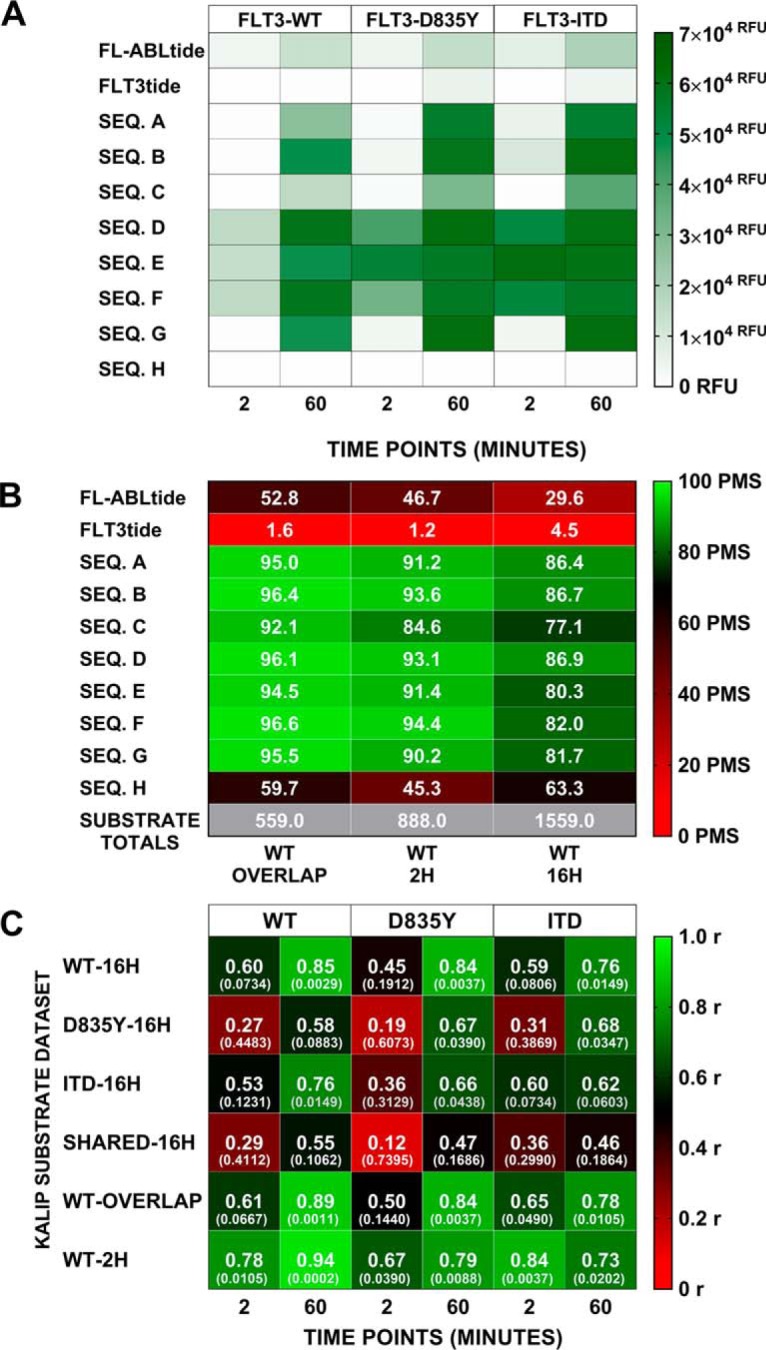
FLT3 kinase variant activity assays and scoring model correlation. A, FLT3 (WT, D835Y and ITD) in vitro kinase assay results for the candidate sequences (A, B, C, D, E, F, G and H). Each FLT3 variant (columns WT, D835Y, ITD) was reacted with each peptide (rows), with aliquots taken at 2 and 60 min (sub-columns). Phosphorylation levels indicated by RFU from ELISA detection, illustrated via color scale (green = high phosphorylation, white = low/no phosphorylation). B, Effect of in vitro KALIP kinase assay incubation time on KINATEST-ID scores for candidate sequences. Positional scoring model scores for each sequence (rows) against the models (columns) derived from all phosphopeptides observed in the WT 2H or 16H KALIP kinase reaction, respectively, or just those observed in both (WT OVERLAP). Color scale from red (low PMS score) to green (high PMS score). C, Spearman's non-parametric correlation test to measure correlation between the KINATEST-ID's scoring system and the in vitro activity assay results. r values shown in bold, above p values denoted in parenthesis. Color scale indicates low (red) to high (green) Spearman r values.