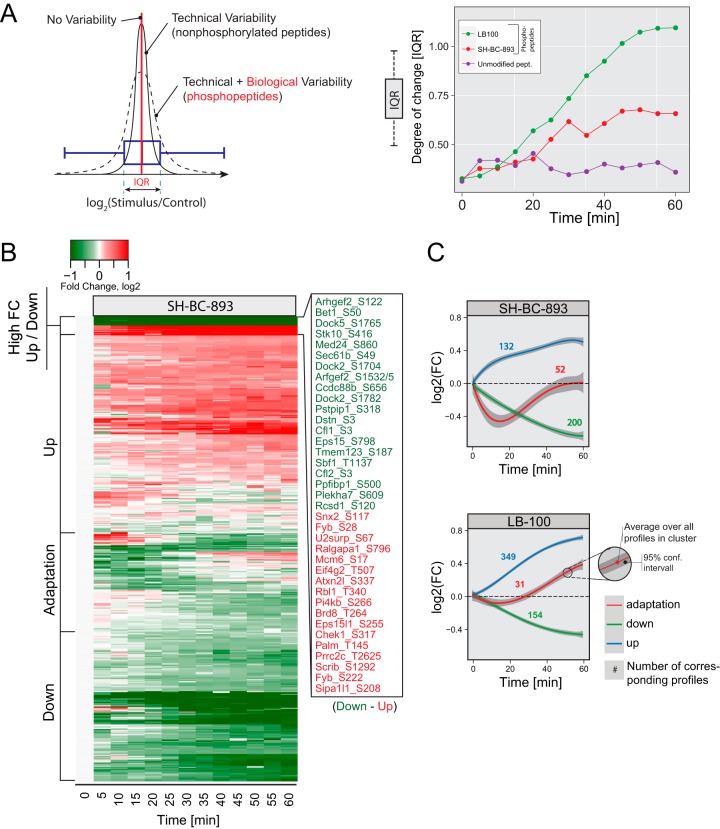
Fig. 3.
Phosphoproteomics results from the comparison of treatments with LB-100 (10 μm) and SH-BC-893 (5 μm). A, Inter quartile range (IQR) shows the global change in phosphorylation on treatment. Unmodified peptides (control) do not change over time whereas LB-100 and SH-BC-893 treatments show a progressive increase in IQR with time. B, Heatmap of all 390 phosphosites regulated by SH-BC-893. Different kinetic behaviors are indicated. C, Kinetic trends extracted from LB-100 and SH-BC-893 treatments using fuzzy means clustering; numbers correspond to profiles observed with a particular kinetic trend.

