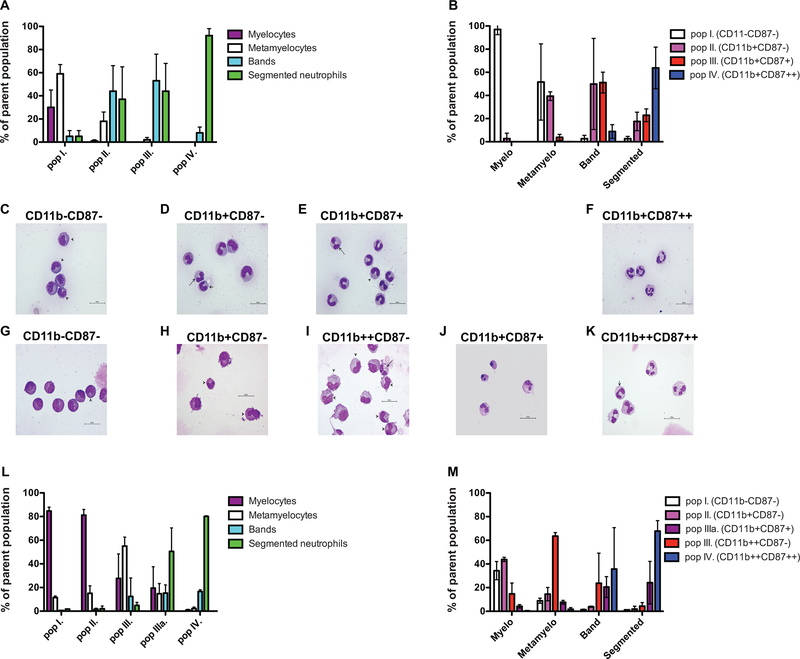
Figure 3. Cellular composition of the CD11b/CD87 defined populations.
Cells were sorted as detailed in the Materials and Methods section. Panels A-F display data from rhesus macaque samples. Panels G-M display data from human samples. A: Relative frequency of the neutrophil progenitors within the four CD11b/CD87 subsets (mean+/−SD; n=3). B: Relative frequency of the CD11b/CD87 subsets within the neutrophil progenitor populations defined by nuclear morphology classification. Representative photomicrographs of subsets described as C: population I−: three metamyelocytes and two myelocytes; D: population II−: one segmented, one band, and three metamyelocyte neutrophils; E: population III: one segmented, seven band, and one metamyelocyte neutrophils; and F: population IV: four segmented neutrophils in a rhesus macaque sample. Representative photomicrographs of subsets described as G: population I−: one metamyelocyte and seven myelocytes; H: population II−: two metamyelocytes and two myelocytes; I: population III: six metamyelocytes, three myelocytes, six metamyelocytes, and one segmented neutrophil; J: population IIIa: two segmented neutrophils and two pyknotic cells; and K: population IV: four segmented and one band neutrophil in a human bone marrow sample. Segmented neutrophils - long arrow, band - medium arrow, and metamyelocytes -short arrow (X1000 magnification). L: Relative frequency of the neutrophil progenitors within the five CD11b/CD87 subsets. M: Relative frequency of the CD11b/CD87 subsets within the neutrophil progenitor populations defined by nuclear morphology classification.

