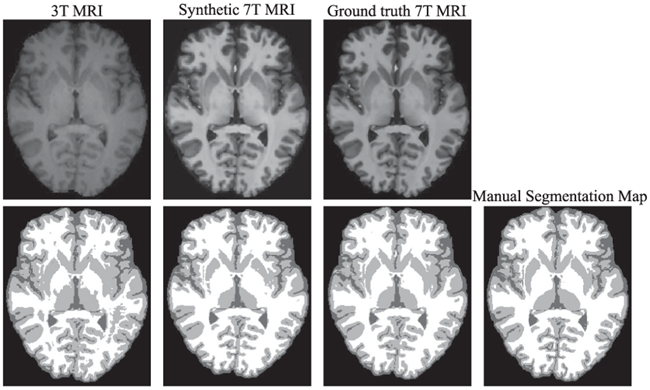
Fig. 18.

Visual comparison of segmentation results for a typical subject by using different input data (3T MRI, synthetic 7T MRI, and ground-truth 7T MRI). The first row is the MRI, and the second shows the segmented slices as well as the manual segmentation map.
