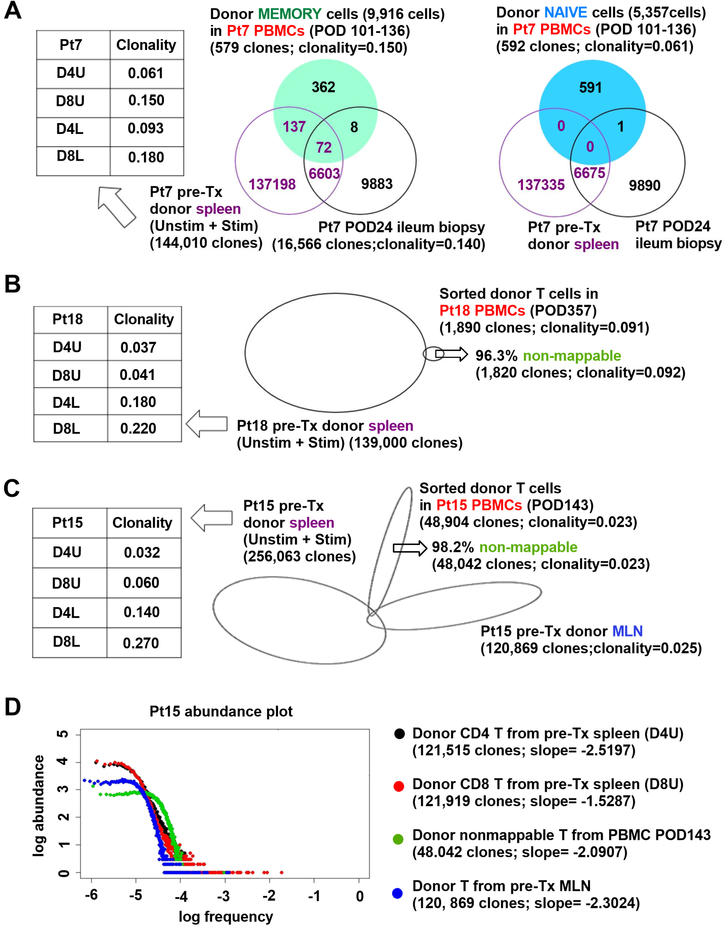
Figure 2. Lack of repertoire overlap between pre-Tx T cells and circulating donor-derivedT cells.
(A) Venn diagram showing TCR clonal overlap among donor memory and naïve T cells sorted from PBMCs POD101–136, pre-Tx donor spleen (including unstimulated [D4U and D8U], and CFSElow stimulated T cells [D4L and D8L]) and post-Tx ileum biopsy (POD24) from Pt7. D4U and D8U represent unstimulated donor CD4 and CD8 T cells, respectively; D4L and D8L repersent CFSElow donor CD4 and CD8 T cell responders in MLRs, respectively. Clonality of each population is shown. (B) Proportional Venn diagram showing TCR clonal overlap among sorted donor T cells in Pt18 PBMCs POD357 (B) or Pt15 PBMCs POD143 (C) and pre-Tx donor spleen or MLN. “Non-mappable” percentage is the percent of TCR sequences in donor PBMC that were not detected in pre-Tx donor spleen or MLN. (D) Abundance plots of nonmappable clones detected from sorted donor T cells in Pt15 PBMCs POD143 (green), and pre-Tx D4U (black) and D8U (red) T cells from spleen or total T cells from MLN (blue), showing relative log abundance of TCR sequences (Y axis) against their log rank in abundance (x axis: low to high frequency). Power-law slopes of abudance plots, whose absolute values vary directly as diversity (DeWolf et al., 2018), are shown. See also Table S1, S2.

