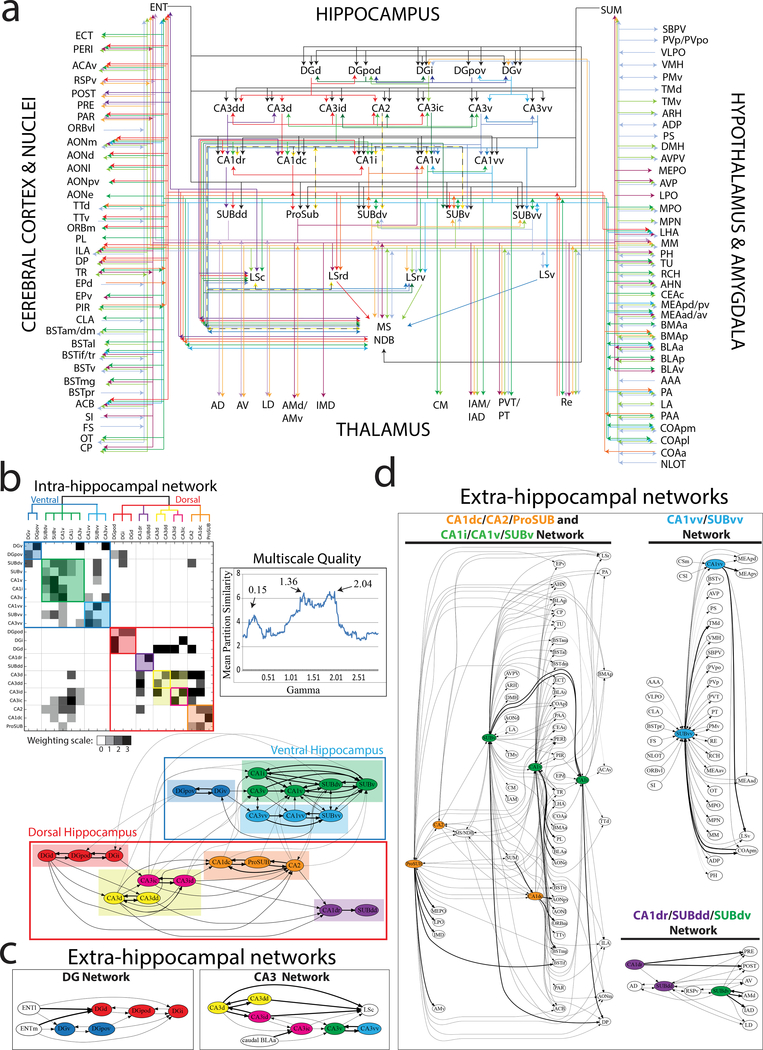
Figure 4. Multiscale neural network analysis of intra- and extra-hippocampal connections.
(a) Unweighted connectome wiring diagram of all inputs and outputs of HGEA hippocampal subregions. Associational connections (e.g. between CA3 subregions) are layered directly below each HGEA subregion group and extrinsic connections are layered further below. For annotated data, see Supplementary Table 5. Visit www.MouseConnectome.org for an interactive version of the wiring diagram. (b) Reordered connectivity matrix and schematic diagram showing the modular hierarchical organization of intrahippocampal subnetworks as defined by current tracing data in HGEA subregions. Mean partition similarity (MPS) was calculated for multiple gamma values to determine which gamma values had the highest MPS peaks (0.15, 1.36, 2.04) to use for matrix reordering (Multiscale Quality graph). In the matrix, edges are shaded according to connectivity weight (0–3, see Supplementary Table 6) and colored boxes along the diagonal reflect modular communities at different scales. The large blue and red outlined boxes corresponds to the two large ‘dorsal and ventral hippocampus’ communities detected at 0.15 gamma, colored shaded boxes correspond to communities detected at 1.36 gamma, and smaller colored outlined boxes correspond to communities detected at 2.04 gamma. Matrix community color scheme corresponds to the organization of the schematic diagram below. In the schematic diagram, line weights refer to connectivity relationships at different scales. Thicker lines refer to modular connections at all scales (within community) whereas thinner lines show modular relationships only at larger scales. (c and d) Five consensus brain-wide communities determined from multiscale community detection on annotated data in Supplementary Table 5 (c, DG and CA3 extrahippocampal networks; d, CA1/SUB extrahippocampal networks [CA1dc/CA2/ProSUB and CA1i/CA1v/SUBv network, CA1vv/SUBvv network, and CA1dr/SUBdd/SUBdv network)]. Similar to the schematic in (b), line weights refer to connectivity relationships at different scales. Node coloring is maintained from intrahippocampal subnetwork analysis in b. Different colored nodes within the extrahippocampal networks suggests multiple intrahippocampal networks provide output to a larger brain-wide network.

