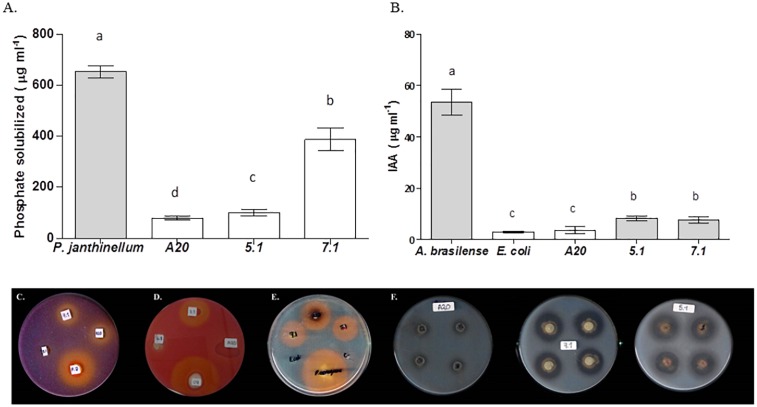
FIGURE 3.
Evaluation of Streptomyces strains for key traits related to direct plant growth promotion. Bars correspond to (A) Phosphate solubilization assay or (B) Indoleacetic Acid production. The results are means of three values ± SD of three independent biological replicates. Means were compared with ANOVA analysis in combination with Tukey post-test. Means were considered statistically different when p < 0.05, and bars sharing a letter are not statistically different. (C) Qualitative phosphate solubilization assay, (D) Cellulase qualitative activity assay, (E) Siderophores qualitative production assay, (F) Protease qualitative production assay.

