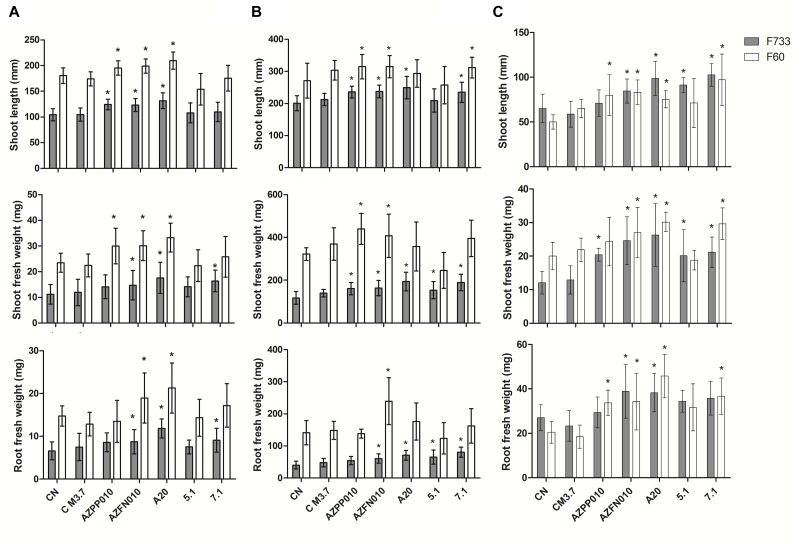
FIGURE 4.
Plant-growth promotion experiments. Bars correspond to (A) Gnotobiotic assay, (B) Sterile Soil assay, and (C) Non-sterile soil assay. The results are means of twenty values ± SD, from two independent biological replicates. Means were compared with ANOVA analysis in combination with Tukey post-test, means were considered statistically different when p < 0.05. Bars with (∗) above are statistically different from the negative control. CN, Negative control. C M3.7, Medium control. AZPP010, A. brasilense. AZFN010, A. chroococcum.

