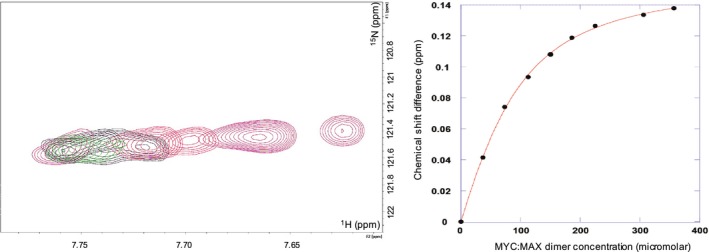
Figure 3.

K d determination of the binding of the MYC:MAX dimer to the INI1/hSNF5 RPT1. On the left overlay of 15N HSQC spectra showing the variation of chemical shift changes induced on L222 by the addition of the unlabeled MYC:MAX dimer. The peak moves from right to left with increasing concentration of the dimer; on the right, plot of the induced chemical shifts versus dimer concentration, fitted to a single‐site binding curve. INI1 RPT1 was employed at a concentration of 147 μm.
