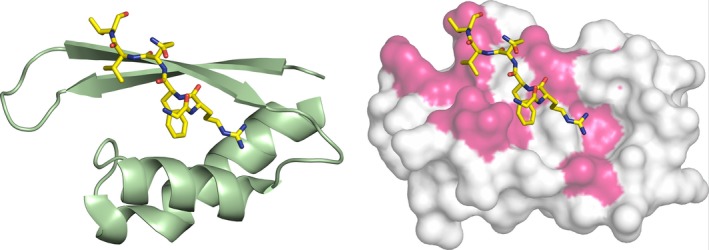
Figure 4.

Comparison of the binding site in INI1/hSNF5 RPT1 and OSR1. On the left cartoon representation of the structure of the OSR1 CCT domain (green) in complex with the RFQV‐peptide (yellow). On the right superimposition of the OSR1 CCT domain (not shown) complex with the RFQV‐peptide (yellow) with the RPT1 structure shown as a molecular surface, with the residues that change chemical shifts upon binding to the MYC:MAX complex highlighted in magenta.
