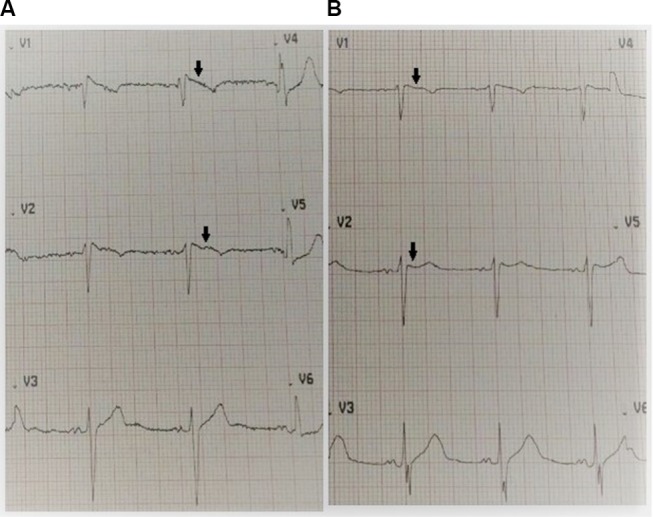
Figure 2.

(A) Admission ECG upon presentation indicating a coved ST-segment elevation (black arrows) in V1 and V2, with elevated J points suggestive of a Brugada type 1 pattern. The patient’s serum sodium was 108 mg/dL (normal 135–145 mg/dL). (B) Day 5 ECG indicating resolution of the Brugada type 1 pattern (black arrows) with normalization of serum sodium. The patient’s serum sodium was 135 mg/dL (normal 135–145 mg/dL).
Abbreviation: ECG, electrocardiogram.
