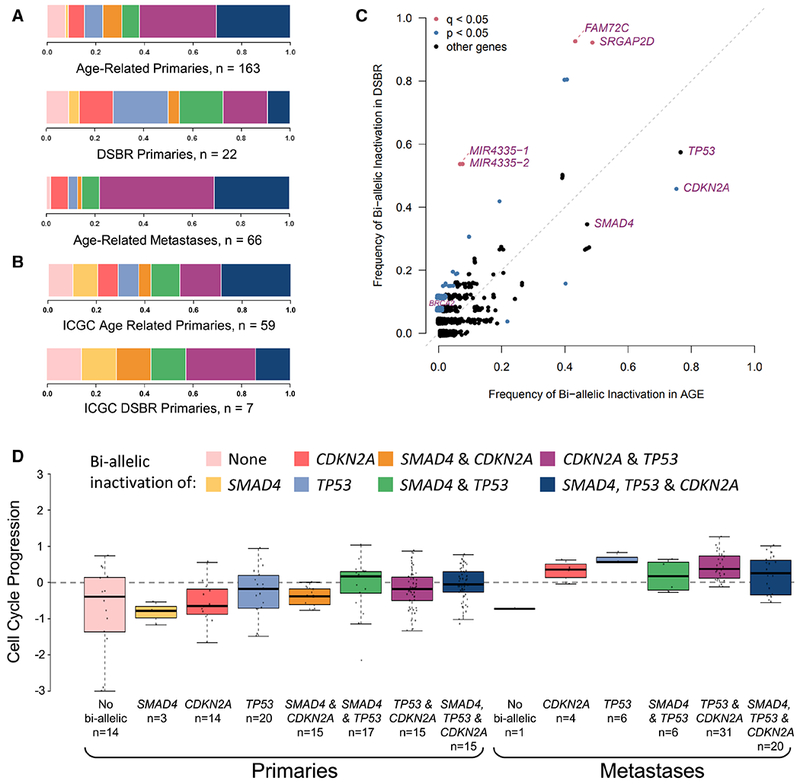
Figure 5: Driver gene inactivation, dominant mutational signature and cell cycle progression.

(A-B) Combinations of bi-allelic inactivation of SMAD4, CDKN2A and TP53 in age-related primary tumors, DSBR-related primary tumors, and age-related metastases (A) and in age-related and DSBR-related primaries from the ICGC dataset (B). (C) Frequency of bi-allelic inactivation in age-related vs DSBR primaries. (D) CCP in primary and metastatic tumors with different combinations of bi-allelic inactivation. Box plots depict the upper and lower quartiles, with the mean shown as a solid line; whiskers indicate the 1.5 times interquartile range (IQR). Data points outside the IQR are shown. See also Figures S2 and S3.
