
Figure 6: Paired tumoral heterogeneity.
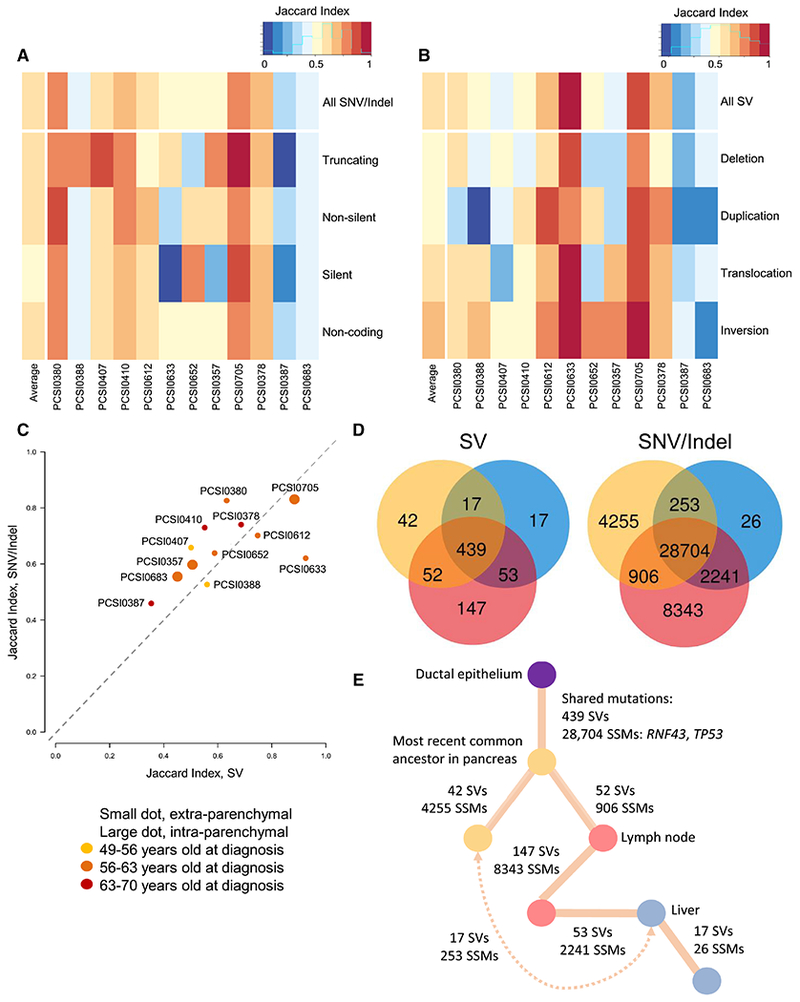
(A-B) Heatmap of Jaccard Indices for SNVs and indels (A) and SVs (B) stratified by mutation type. (C) Scatterplot of Jaccard Indices for average simple (y-axis) and structural (x-axis) variation for each tumor pair, colored by age at diagnosis. (D-E) Tumor heterogeneity in PCSI_0378 with Venn diagrams showing shared burden of structural (left) and SNV/indels (right) (D), with inferred phylogeny (E). Note: this case has a strong DSBR signature. See also Figures S6 and S7.