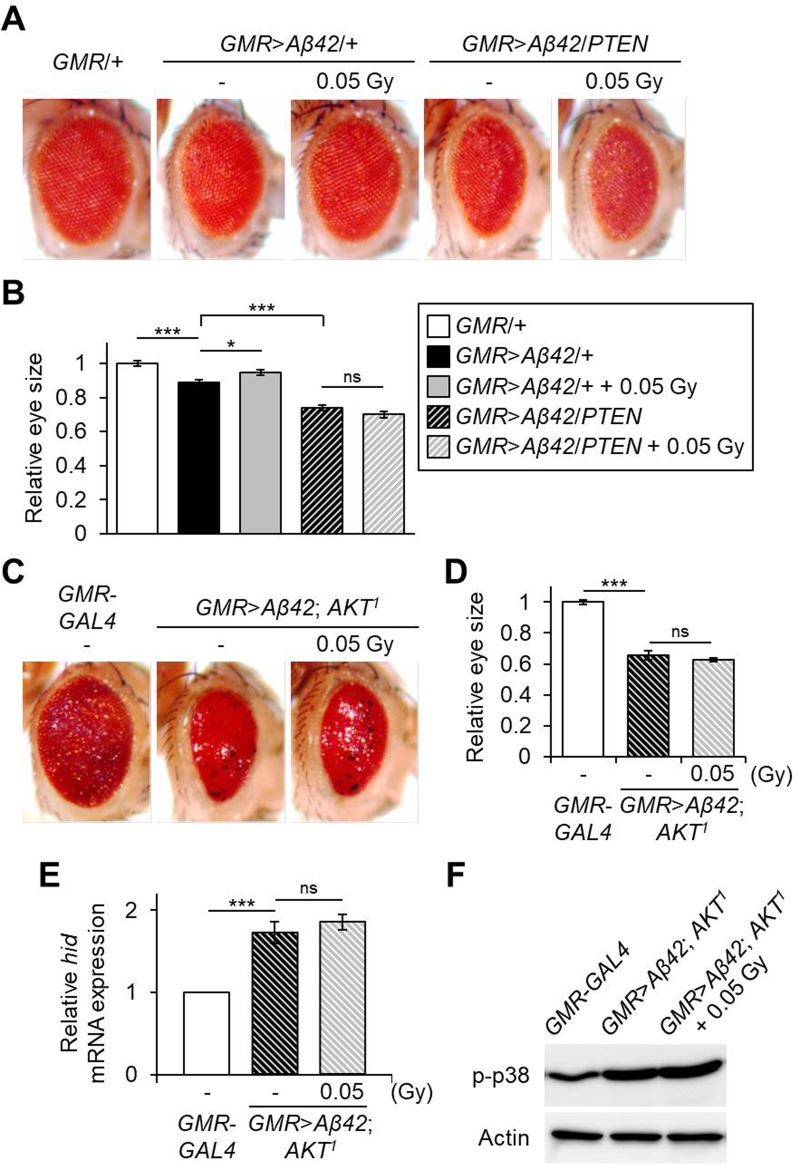
Fig. 5.
Effects of AKT inhibition on the response to low-dose ionizing radiation in Aβ42-expressing flies. (A) Representative eye images showing the effects of low-dose (0.05 Gy) ionizing radiation on Aβ42-expressing (GMR>Aβ42/+) or Aβ42- and PTEN-co-expressing (GMR>Aβ42/PTEN) flies. GMR/+ was used as a wild-type control. (B) Graph shows the relative size of eyes in each indicated fly group (n≥6) compared to GMR/+ control flies. (C) Representative eye images showing the effects of low-dose (0.05 Gy) ionizing radiation on AKT deficiency (AKT1) in Aβ42-expressing flies. (D) Graph shows the relative size of eyes in each indicated group (n≥6) compared to GMR-GAL4 control flies. (E) Relative mRNA levels of hid in the Aβ42-expressing and AKT mutant flies (GMR>Aβ42; AKT1) after exposure to γ-irradiation of 0.05 Gy compared to GMR-GAL4 control flies by qPCR (n=3). (F) Levels of p-p38 in the heads of indicated groups by western blot. Actin was used as an internal control. Data are expressed as mean±s.e.m. *P<0.05, ***P<0.001. -, untreated control; ns, not significant.

