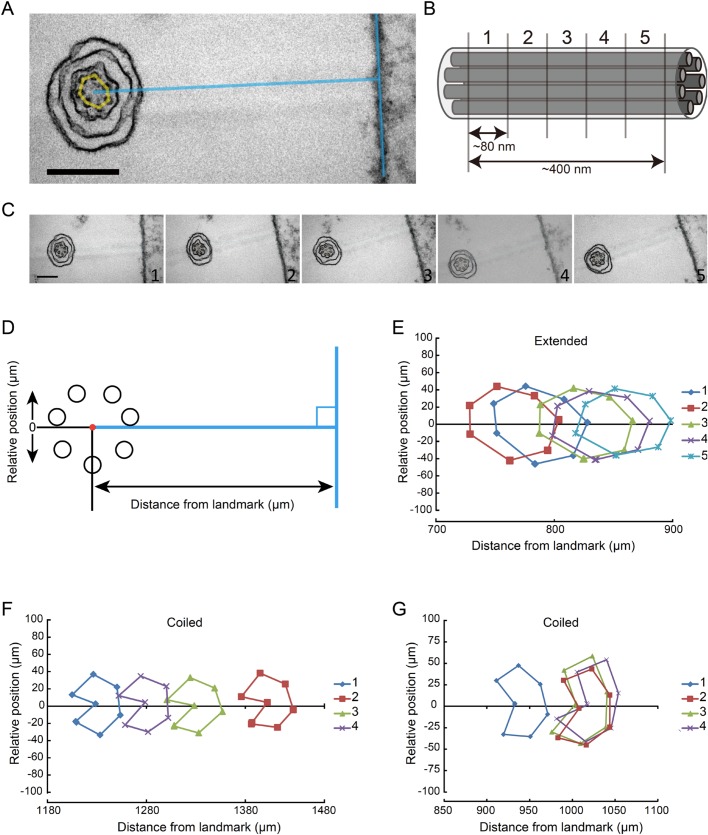
Fig. 3.
Arrangement of microtubules along a haptonema. (A) Extended haptonema adjacent to the poly-lysine-BSA coated Epon surface (landmark). To position each microtubule, a line was drawn from the center of the microtubule bundle at right angles to the surface. Scale bar: 200 nm. (B) Approximately 80 nm sequential sections were made. For example, five sections covered a 400 nm length of a haptonema along the longitudinal axis. (C) Example of sequential images of an extended haptonema. Scale bar: 200 nm. (D) Definition of the distance from the landmark and the relative position of each microtubule. (E) Typical plot of microtubule positions in five sequential images of an extended haptonema. (F) Typical plot of microtubule positions in five sequential images of a coiled haptonema. (G) Plot showing a helical arrangement of the seven microtubules in a coiled haptonema. Four out of 24 sets of sequential images of the coiled haptonema showed this pattern.

