Fig. 1.
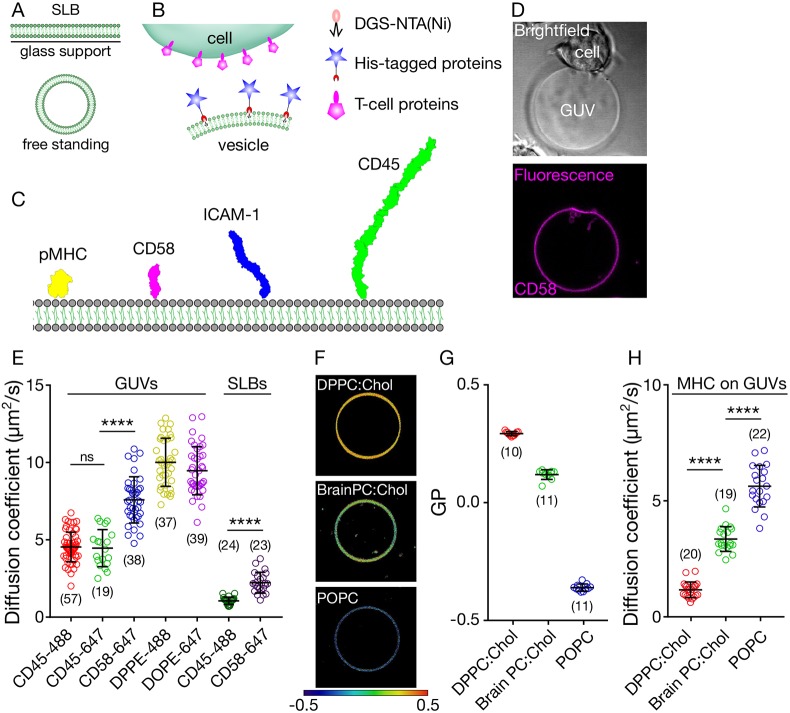
The in vitro system. (A) Depiction of supported lipid bilayers and free-standing vesicles. (B) Scheme showing the in vitro cell–vesicle interaction. (C) Molecules of interest for this study, drawn to scale based on structure determinations (Chang et al., 2016). (D) Example bright field (top) and fluorescence (bottom) images of CD2+ Jurkat–CD58+ GUV contact (image size 50 µm×50 µm). (E) Diffusion analysis of fluorescently labelled lipids and proteins in GUVs and SLBs. (F) Lipid packing of GUVs of varying composition revealed by a GP map (image size 40 µm×40 µm). (G) Quantification of the GP. (H) Diffusion analysis of fluorescently labelled pMHC on GUVs composed of different lipids. Student's t-test (two-tailed) was used to determine significance (****P<0.0001). Error bars represent standard deviation of the mean. Number of data points obtained from at least three independent experiments are indicated on the graphs in parentheses.

