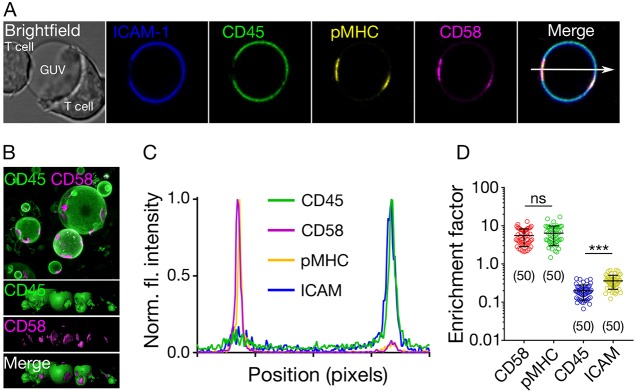
Fig. 2.
Protein reorganisation at cell–GUV contacts. (A) Distribution of ICAM-1, CD45, pMHC and CD58 at cell–GUV contacts (image size 40 µm×40 µm). (B) 3D image (top, top view of raw image; bottom, side views of surface image) of the contact formed between 1G4 T cells and GUVs, showing the abundance of contacts formed (image size 75 µm×75 µm). (C) Intensity line profile (arrow shown in A) of the fluorescence signal through the T cell contacting the GUV. (D) Quantification of the fluorescence signal inside and outside of the contacts (inside/outside ratio) for all four proteins. Student's t-test (two-tailed) was used to determine significance (***P<0.001). Error bars represent standard deviation of the mean. Data are representative of at least three independent experiments and for each data set, the number of data points is indicated on the graphs in parentheses.

