Fig. 3.
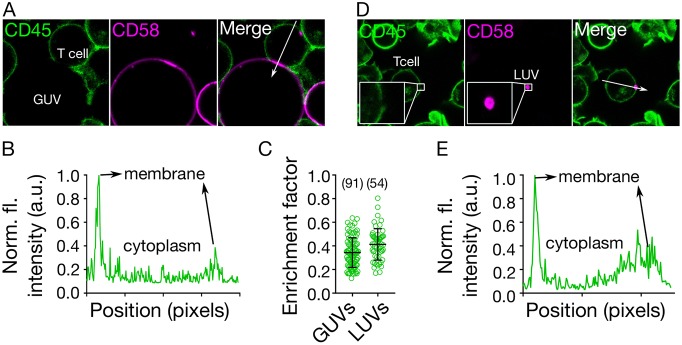
Requirements for CD45 segregation. (A) Distribution of CD45 (on the T cell surface) and CD58 (attached to the GUV), showing that close contact induces local exclusion of CD45 phosphatase (image size 40 µm×40 µm). (B) Line plot of CD45 fluorescence intensity indicated by white arrow in A. (C) CD45 exclusion at GUV/LUV–cell contacts. The enrichment factor represents the ratio of fluorescence intensity at the contact site versus non-contact site. (D) Small LUVs (<250 nm, coated with CD58) induce exclusion of CD45 on cells (image size 50 µm×50 µm). (E) Line plot of CD45 fluorescence intensity indicated by white arrow in D. Cells were labelled with anti-CD45 Gap8.3 Fab-Alexa Fluor 488. Error bars represent standard deviation of the mean. Data is representative of at least three independent experiments; for each data set, the number of data points is indicated on the graphs in parentheses.

