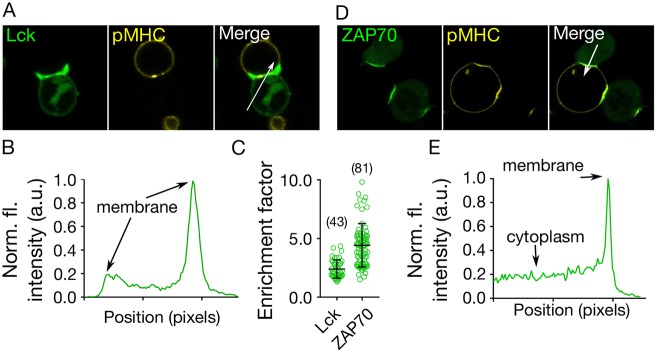
Fig. 4.
GUV-induced activation of T cells. (A) Cellular localisation of Lck (labelled with EGFP, green) following T cell binding to GUVs coated with pMHC. (B) The intensity line profile of the Lck fluorescence signal through the contact (arrow in A) shows enrichment of Lck at the contact. (C) Enrichment of Lck/ZAP70 at GUV–cell contact sites. The enrichment factor represents the ratio of fluorescence intensity at the contact site versus non-contact site (cytoplasmic signal for ZAP70). (D) Cellular localisation of ZAP70 (labelled with HaloTag™) upon binding to vesicles carrying pMHC. (E) The intensity line profile of the ZAP70–HaloTag fluorescence signal through the contact zone (arrow in D) shows enrichment at the contact (image size 40 µm×40 µm). Error bars represent standard deviation of the mean. Data is representative of at least three independent experiments and the number of data points is indicated on the graphs in parentheses.

