Fig. 1.
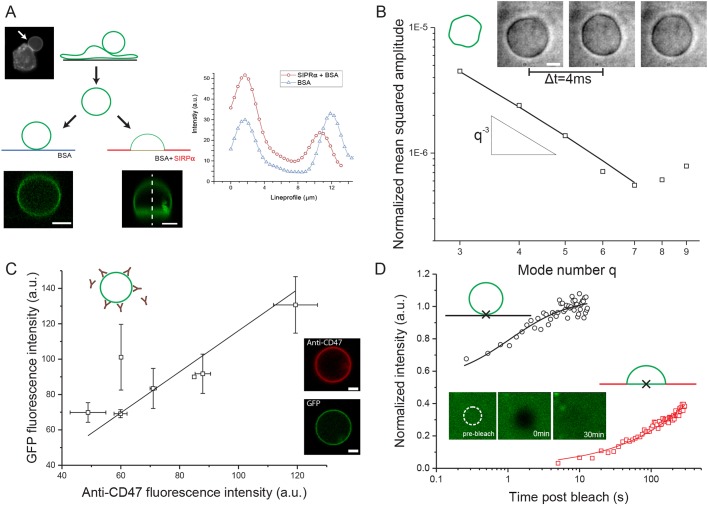
GPMV characterization and CD47-GFP diffusion. (A) GPMV formation from CD47-GFP-expressing HEK cells. Left: epi-fluorescence image of a cell with an attached GPMV (arrow). Left: epi-fluorescence image of a cell with an attached GPMV (arrow). Right: confocal microscopy z-stacks of a free GPMV on a BSA-coated coverslip (left) or an adherent GPMV on a SIRPα-coated coverslip (right). Representative fluorescent intensity traces quantified from image stacks. Lines are guides to the eye. (B) Fluctuation analyses of GPMVs are compatible with elastic sheet model of bending rigidity κ≈10±3 kBT (mean±s.d.) Inset shows phase contrast images of thermal fluctuations. Low exposure times of 200 μs and 4000 images per vesicle avoid artefacts from averaging fast fluctuations. (C) Anti-CD47 and GFP signals correlate in confocal microscopy: y=1.2x (R2=0.98). Each data point corresponds to measurement of an individual GPMV in at least two independent experiments. Error bars indicate s.d. (D) Representative recovery curve in FRAP of CD47-GFP on unbound membrane segments (black circles) with fit to free diffusion model, and after bleaching the adhering membrane segment (red squares) with fit to adhesion model. Data were normalized to the average fluorescent intensity of the unbleached area before application of the bleaching pulse. Note the logarithmic time scale. Crosses indicate bleached location on vesicles. Inset images show bleached CD47-GFP, indicating full recovery on longer timescales. White circle indicates bleached area of 1 μm in diameter. Scale bars: 5 µm.

