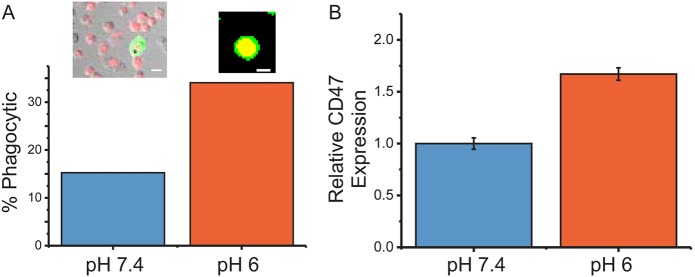
Fig. 4.
Phagocytosis and CD47 levels change with acidosis. (A) Phagocytic uptake assay of opsonized A549 (red in insets) cells by THP-1 macrophages (green). Yellow indicates overlapping cells, and full overlap indicates completed phagocytosis. Shift to pH 6 increases such engulfment. Left inset shows phase-contrast images overlaid with fluorescence. Scale bars: 10 μm. Data from two independent experiments (n=90 cells for pH 7, n=47 for pH 6). (B) CD47 levels increase on viable A549 cells under acidosis conditions. Experiment was performed with three technical replicates. Error bars are ±s.e.m. Differences between distributions are significant (P<0.05, t-test).

