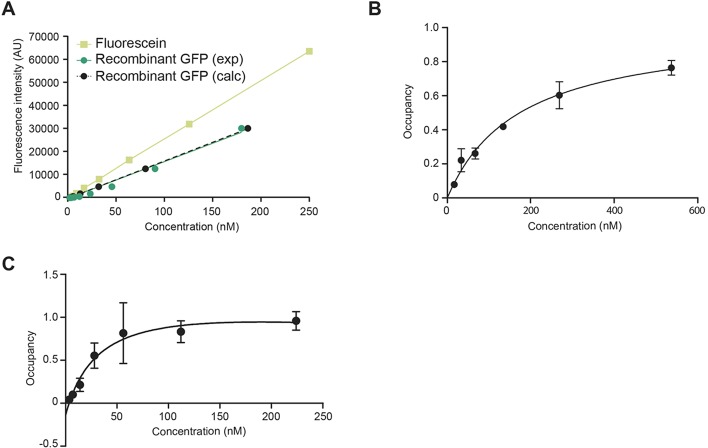
Fig. 2.
Quantitative measurements of protein-lipid interaction with ProLIF. (A) Comparison of GFP and fluorescein standard curves. The fluorescence intensities of the indicated concentrations of fluorescein and recombinant GFP were determined experimentally (exp) and used to generate standard curves. The fluorescein standard curve was then used to calculate (calc) the theoretical GFP standard curve using Eqn (1). (B) Titration curve of BTK-PH–EGFP binding to PI(3,4,5)P3-containing liposomes (n=2). Cell lysates from BTK-PH–EGFP-transfected cells were diluted to contain the indicated concentrations of the EGFP-tagged protein [calculated as in Fig. 2A using Eqn (1)] and incubated with the liposomes. Protein–liposome interactions were subsequently analysed by FACS as outlined by the workflow in Fig. 1A. (C) Titration curve of tandem FYVE–EGFP binding to PI(3)P-containing liposomes (n=2). Cell lysates from tandem FYVE–EGFP-transfected cells were diluted to contain the indicated concentrations of the EGFP-tagged protein [calculated as in Fig. 2A using Eqn (1)] and incubated with the liposomes. Protein–liposome interactions were subsequently analysed by FACS as outlined in the workflow in Fig. 1A.

