Fig. 5.
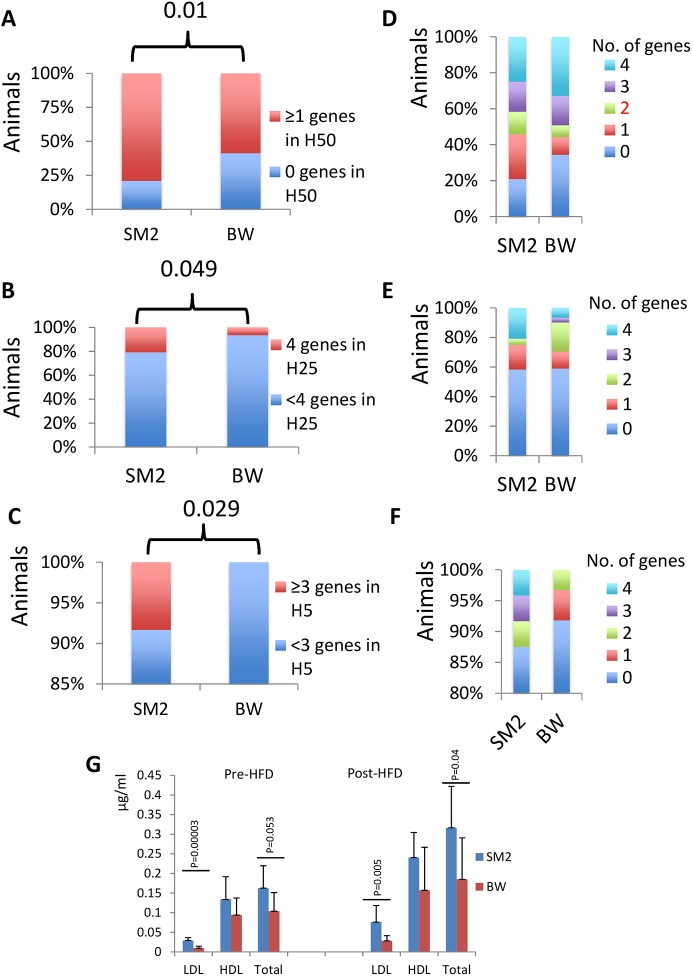
Differences in the UPR profile in primary fibroblasts between high (SM2 population, n=24)- and low (BW population, n=61)-altitude deer mice. (A) Percentage of animals in each of the SM2 or BW populations that have at least 1 UPR gene in the highest 50th percentile (H50) of the total population. The P-value is shown (chi-square test). (B) Percentage of animals in each of the SM2 or BW populations that have all 4 UPR genes in the highest 25th percentile (H25) of the total population. The P-value is shown (chi-square test). (C) Percentage of animals in each of the SM2 or BW populations that have 3 or 4 UPR genes in the highest 5th percentile (H5) of the total population. The P-value is shown (chi-square test). (D-F) The corresponding distribution for the number of genes in each analysis in A, B and C, respectively. For these analyses, maximal expression was considered. (G) Average lipid levels in SM2 (n=5) or BW (n=10) prior to or after high-fat-diet (HFD) administration for 2 weeks. P-values (Student’s t-test) are shown. HDL, high-density lipoprotein; LDL, low-density lipoprotein.

