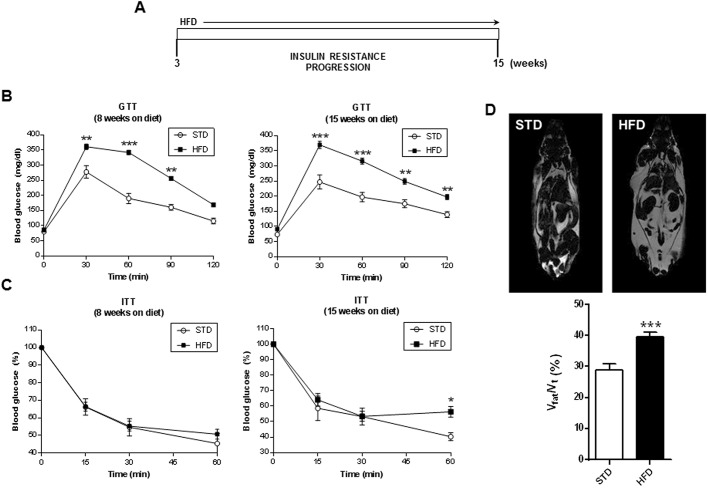
Fig. 1.
Characterization of the mouse model of diet-induced insulin resistance and obesity. (A) Scheme of HFD-induced insulin resistance progression. (B) Glucose tolerance test (GTT) in STD (n=5) and HFD (n=21) mice at 8 (left) or 15 (right) weeks on the diet. (C) Insulin tolerance test (ITT) in STD (n=5) and HFD (n=21) mice at 8 (left) or 15 (right) weeks on the diet. (D) Representative nuclear magnetic resonance (NMR) images of STD (top left) and HFD (top right) mice; quantification of NMR images of STD (n=5) and HFD (n=9) groups prior to AAV administration (bottom). Results are expressed as mean±s.e.m. Statistical significance was assessed by one-way ANOVA with Bonferroni post test in B and C, and by two-tailed unpaired Student's t-test in D, comparing HFD mice with the STD group (*P<0.05, **P<0.01 and ***P<0.001).

