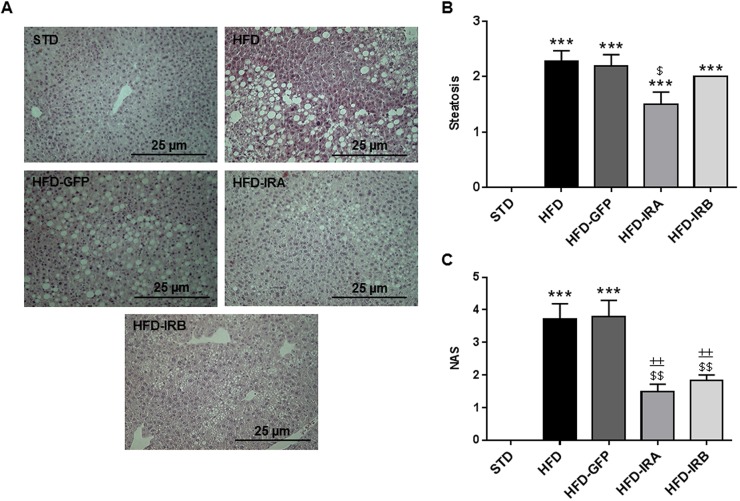
Fig. 6.
IRA and IRB expression in the liver improves the NAFLD degree. (A) Representative images of liver histological analysis through H&E staining. Image magnification: ×20. (B) Quantification of steatosis degree (n=7 per group). (C) Quantification of NAS according to liver abnormalities in all groups (n=7 per group). Results are expressed as mean±s.e.m. Statistical significance was assessed by one-way ANOVA with Bonferroni post test [versus STD mice (***P<0.001), versus HFD mice ($P<0.05 and $$P<0.01) and versus HFD-GFP mice (±±P<0.01)].

