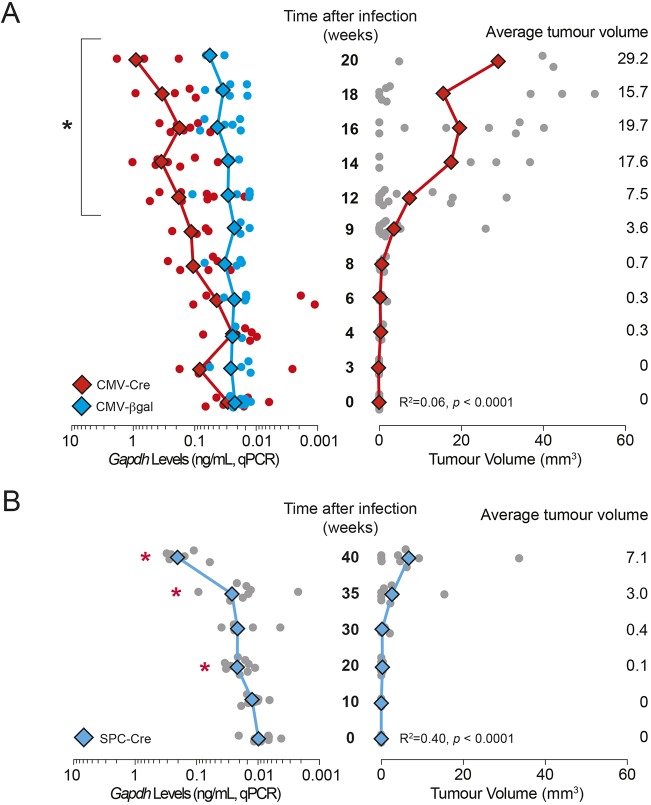
Fig. 3.
Monitoring of cfDNA levels using Gapdh analysis by qPCR. (A) Gapdh levels as measured by qPCR in cfDNA in comparison to tumour burden in Kras+/LSL-G12D mice over a time course following infection with Ad5-CMV-Cre (red) or Ad5-CMV-βgal (blue). Total tumour burden was quantitated from micro-CT imaging. Gapdh levels were measured by qPCR of circulating DNA derived from the plasma of mice at each time point. Mean values are indicated by diamonds/lines; values for individual mice are indicated by circles (n=3-12 at each time point). *P<0.05 for two-tailed unpaired Student's t-test comparisons between mean values at a given time point and values at time=0. The correlation coefficients between Gapdh levels and tumour burden are indicated (linear regression analysis; P-value, goodness of fit). (B) Gapdh levels in cfDNA as measured by qPCR in comparison to tumour burden in Kras+/LSL-G12D mice over a time course following infection with Ad5-mSPC-Cre. Mean values are indicated by diamonds/lines; values for individual mice are indicated by circles (n=4-9 at each time point). *P<0.05 for two-tailed unpaired Student's t-test comparisons between mean values at a given time point and values at time=0. The correlation coefficients between Gapdh levels and tumour burden are indicated (linear regression analysis; P-value, goodness of fit).

