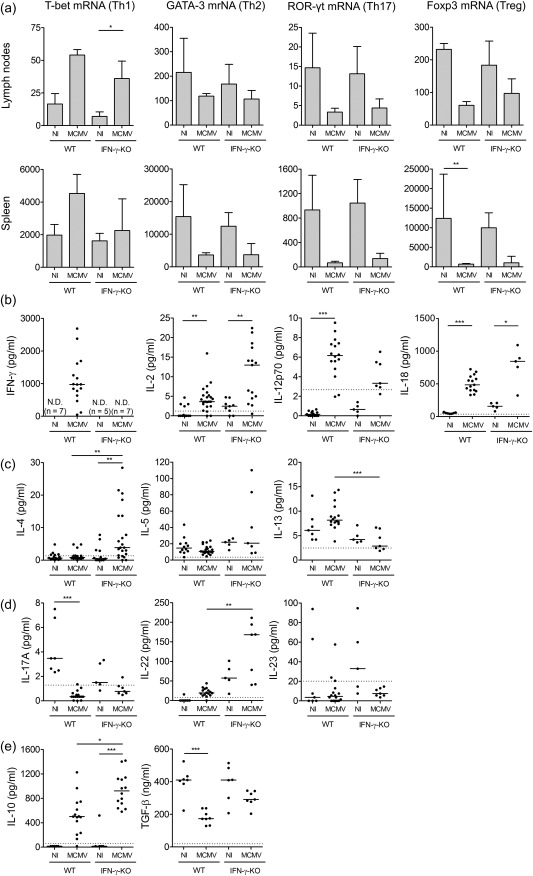
Figure 1.

Prevalence of T helper (Th) cell populations in mouse cytomegalovirus (MCMV)‐infected wild‐type (WT) and interferon (IFN)‐γ knock‐out (KO) mice. (a) mRNA expression of Th cell transcription factors in cells extracted from inguinal lymph nodes and spleen as determined via reverse transcription–quantitative polymerase chain reaction (RT–qPCR). T‐bet for Th1 cells, GATA binding protein 3 (GATA‐3) for Th2 cells, retinoid‐related orphan receptor gamma t (ROR‐γt) for Th17 cells and forkhead box protein 3 (FoxP3) for regulatory T cells (Treg). Bars refer to means, with standard deviation; n = 5 per group. Normalized to glyceraldehyde 3‐phosphate dehydrogenase (GAPDH) expression with the 2–ΔΔCt method. (b–e) Th cell‐associated cytokine concentrations in serum. Interferon (IFN)‐γ, IL‐2, IL‐12 and IL‐18 for Th1 (b), IL‐4, IL‐5 and IL‐13 for Th2 (c), IL‐17A, IL‐22 and IL‐23 for Th17 (d), IL‐10 and transforming growth factor (TGF)‐β for Tregs (e). Dots represent individual animals. Horizontal bars refer to median values. Data obtained on day 5 post‐infection. Dotted lines represent lower enzyme‐linked immunosorbent assay (ELISA) detection limits. n.d. = not detected (detection limit 6·11 pg/ml); NI = not infected; Th = T helper. *P < 0·05; **P < 0·01; ***P < 0·001; Kruskal–Wallis with Dunn's post‐test. Depicted data are from one to four experiments and representative of four independent experiments with at least five mice per group.
