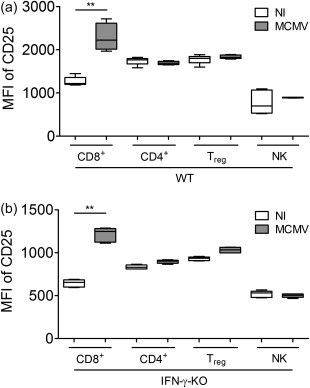
Figure 5.

Reversal of the interleukin (IL)‐2 consumption hierarchy in mouse cytomegalovirus (MCMV)‐infected wild‐type (WT) and interferon (IFN)‐γ knock‐out (KO) mice. Median fluorescence intensity (MFI) of CD25 on CD25+CD8+, CD4+, regulatory T cells (Treg) and natural killer (NK) cells in inguinal lymph nodes in WT (a) and IFN‐γ KO mice (b). (a,b) Box‐plots represent median ±25% quartile, whiskers from minimum to maximum. White boxes, NI = not infected. Grey boxes, MCMV‐infected; five mice per group. Data obtained on day 5 post‐infection. **P < 0·01; Kruskal–Wallis with Dunn's post‐test. Depicted data are from one experiment and representative of three experiments with at least five mice per group.
