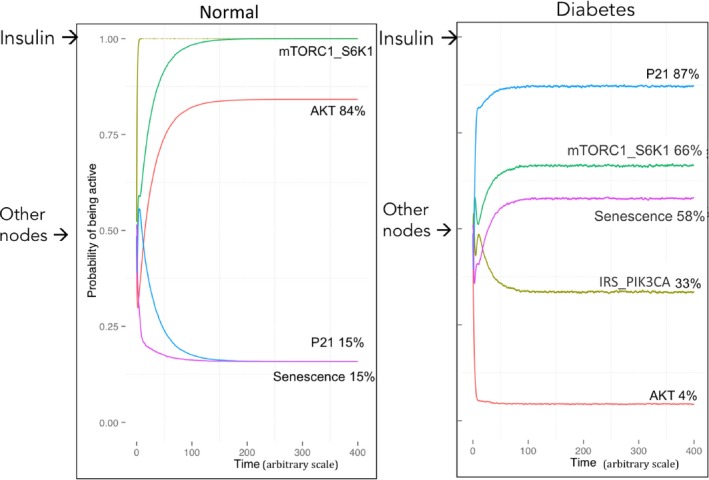
Figure 2.

Simulations of the normal and the diabetes models. mTORC1_S6K1, AKT, senescence, and p21 are plotted using MaBoSS: The percentages represent the probability for a node of being active in time (arbitrary scale). Initial states of every variable simulated from the model are defined as random (‘Other nodes→‘) except for the insulin input defined=1 (‘Insulin→ ‘). (Left panel) Simulations for the normal model; (right panel) simulations for the diabetes model.
