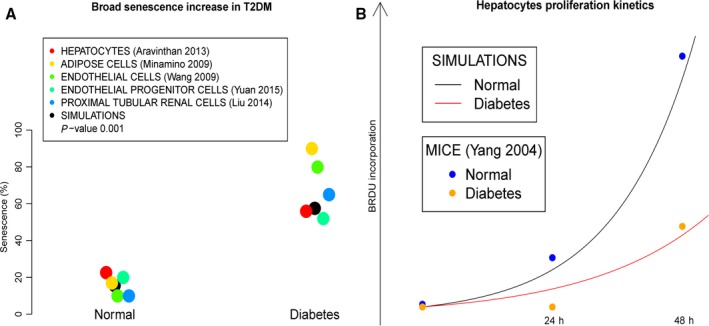
Figure 3.

Comparison of the phenotypes between the normal and diabetes models. (A) The probabilities of senescence in the normal and diabetes models (black dots) reproduce the reported measurements of cell senescence proportions in a variety of tissues for the same conditions (color dots). (B) The proliferation kinetics deduced from the probabilities of S‐phase entry (G1_S) and senescence in the normal and diabetes models (black and red lines) reproduce the reported hepatocytes proliferation kinetics for the same conditions.
